如何使用SAP事务码SAT进行UI应用的性能分析

简介:

Sent: Wednesday, July 11, 2012 7:49 PM

Subject: 【Knowledge share】How to trace UI transaction using SAT

Have you ever noticed this button in SAT during your testing? We can use it to trace transaction which are not launched by backend.

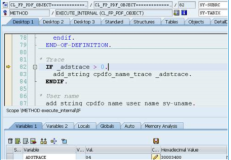
Suppose I want to trace the performance when I click product hyperlink in search result. First I have to set a breakpoint to the event handler and launch UI to trigger the breakpoint.

Once BP is triggered, click button highlighted above, select the session and click button “Activate Measurement”.

Once done there is a new yellow light indicating that trace is switched on. The trace file is also generated accordingly.

Then click F8 to finish execution, and deactivate the trace. Now the SAT file is ready with a green light turned on.

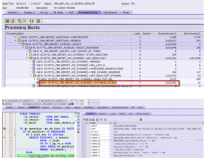
At this time, please do not directly go to SAT and view your trace file: It will not work. Instead please just double click the green light, it will automatically format SAT file for you.


Once done, it will also be displayed correctly in SAT.

本文来自云栖社区合作伙伴“汪子熙”,了解相关信息可以关注微信公众号"汪子熙"。

相关文章
|
1月前
|
开发工具 开发者
应用研发平台EMAS在接入崩溃分析、性能分析和远程日志的时候
【2月更文挑战第28天】应用研发平台EMAS在接入崩溃分析、性能分析和远程日志的时候
16 6
|
10月前
|
运维 Prometheus 监控
可观测性与应用监控:实时性能分析和故障排查
在现代软件开发中,应用程序的可观测性和实时性能分析变得越来越重要。随着应用程序规模和复杂性的增加,我们需要能够及时发现和解决潜在的性能问题和故障,并保持应用程序的高可用性。在本文中,我们将讨论可观测性的概念以及应用监控中的实时性能分析和故障排查方法。
140 0
|
SQL
SAP CRM Fiori 应用 my Opportunities 的后台性能分析
The performance bottleneck of this url /sap/opu/odata/NBA/CRM_OPPORTUNITY_SRV/Opportunities()?KaTeX parse error: Expected 'EOF', got '&' at position 99: …ode eq 'E0003')&̲orderby=Score desc&KaTeX parse error: Expected 'EOF', got '&' at position 7: top=50&̲select=Id,CIFId,PriorityCode,SalesStage
113 0
SAP CRM Fiori 应用 my Opportunities 的后台性能分析
使用 ADS 渲染 SAP Adobe Form 的性能分析
可以手动拿到: 在这个方法里设个断点,在UI上点preview,断点触发后手动把_adstrace改成04,回车。
183 0
使用 ADS 渲染 SAP Adobe Form 的性能分析
|
2月前
|
Rust 数据可视化 安全
Rust性能分析工具概览:perf、flamegraph 与其他
Rust作为一种高性能、内存安全的编程语言,在构建大型系统和微服务时备受青睐。然而,优化Rust程序的性能需要有效的工具。本文将对Rust中常用的性能分析工具进行介绍,包括perf、flamegraph等,并探讨它们如何帮助开发者定位和解决性能瓶颈。
|
29天前
|
数据可视化 关系型数据库 编译器
【C/C++ 单线程性能分析工具 Gprof】 GNU的C/C++ 性能分析工具 Gprof 使用全面指南
103 2
|
8月前
|
SQL 关系型数据库 MySQL
第09章 性能分析工具的使用【2.索引及调优篇】【MySQL高级】1
74 0
|
1天前
|
Web App开发 JavaScript 前端开发
JavaScript中的性能优化:代码优化技巧与性能分析工具
【4月更文挑战第22天】本文探讨JavaScript性能优化,包括代码优化技巧和性能分析工具。建议避免全局查找、减少DOM操作、使用事件委托、优化循环和异步编程以提升代码效率。推荐使用Chrome DevTools、Lighthouse和jsPerf等工具进行性能检测和优化。持续学习和实践是提升JavaScript应用性能的关键。

热门文章

最新文章