https://engineering.linkedin.com/blog/2016/05/open-sourcing-kafka-monitor
https://github.com/linkedin/kafka-monitor
https://github.com/Microsoft/Availability-Monitor-for-Kafka
Design Overview
Kafka Monitor makes it easy to develop and execute long-running Kafka-specific system tests in real clusters and to monitor existing Kafka deployment's SLAs provided by users.
Developers can create new tests by composing reusable modules to emulate various scenarios (e.g. GC pauses, broker hard-kills, rolling bounces, disk failures, etc.) and collect metrics; users can run Kafka Monitor tests that execute these scenarios at a user-defined schedule on a test cluster or production cluster and validate that Kafka still functions as expected in these scenarios. Kafka Monitor is modeled as manager for a collection of tests and services in order to achieve these goals.
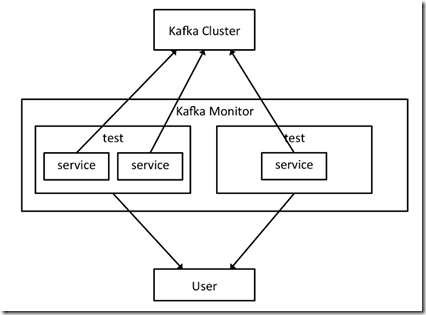
A given Kafka Monitor instance runs in a single Java process and can spawn multiple tests/services in the same process. The diagram below demonstrates the relations between service, test and Kafka Monitor instance, as well as how Kafka Monitor interacts with a Kafka cluster and user.
这个平台比较有意思在于,不光是监控那么简单,
还包含完整的test框架,可以定义任意test,test由各种service,即组件,组合而成
- Produce service, which produces messages to Kafka and measures metrics such as produce rate and availability.
- Consume service, which consumes messages from Kafka and measures metrics including message loss rate, message duplicate rate and end-to-end latency. This service depends on the produce service to provide messages that embed a message sequence number and timestamp.
- Broker bounce service, which bounces a given broker at some pre-defined schedule.
用上面的3个services,就可以组合出一个测试broker bounce的test
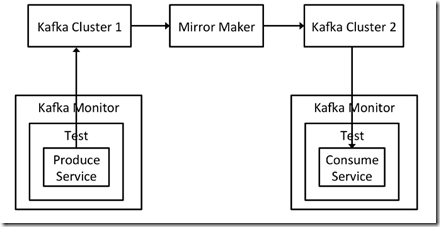
或者上面的case,通过两个kafka monitor,可以测试多datacenter之间的同步
Kafka Monitor Usage at LinkedIn
Monitoring Kafka Cluster Deployments
In early 2016 we deployed Kafka Monitor to monitor availability and end-to-end latency of every Kafka cluster at LinkedIn. This project wiki goes into the details of how these metrics are measured. These basic but critical metrics have been extremely useful to actively monitor the SLAs provided by our Kafka cluster deployment.
Validate Client Libraries Using End-to-End Workflows
As an earlier blog post explains, we have a client library that wraps around the vanilla Apache Kafka producer and consumer to provide various features that are not available in Apache Kafka such as Avro encoding, auditing and support for large messages. We also have a REST client that allows non-Java application to produce and consume from Kafka. It is important to validate the functionality of these client libraries with each new Kafka release. Kafka Monitor allows users to plug in custom client libraries to be used in its end-to-end workflow. We have deployed Kafka Monitor instances that use our wrapper client and REST client in tests, to validate that their performance and functionality meet the requirement for every new release of these client libraries and Apache Kafka.
Certify New Internal Releases of Apache Kafka
We generally run off Apache Kafka trunk and cut a new internal release every quarter or so to pick up new features from Apache Kafka. A significant benefit of running off trunk is that deploying Kafka in LinkedIn’s production cluster has often detected problems in Apache Kafka trunk that can be fixed before official Apache Kafka releases.
Given the risk of running off Apache Kafka trunk, we take extra care to certify every internal release in a test cluster—which accepts traffic mirrored from production cluster(s)—for a few weeks before deploying the new release in production. For example, we do rolling bounces or hard kill brokers, while checking JMX metrics to verify that there is exactly one controller and no offline partitions, in order to validate Kafka’s availability under failover scenarios. In the past, these steps were manual, which is very time-consuming and doesn’t scale well with the number of events and types of scenarios we want to test. We are switching to Kafka Monitor to automate this process and cover more failover scenarios on a continual basis.


