一.简述
Nmon是一款计算机性能系统监控工具,因为它免费,体积小,安装简单,耗费资源低,广泛应用于AIX和Linux系统。nmon的使用需要2部分:nmon采集数据和nmon_analyzer可视化分析数据

二.下载
根据服务器类型选择对应的nmon版本,nmon_analyser在win下都可以使用
Nmon下载地址
nmon_analyzer_v61下载地址
nmon_analyser_v60下载地址
三.性能数据采集
1.解压
tar -zxvf nmon_linux_14g.tar.gz2.赋权
chmod 755 nmon_linux_x86_643.执行采集
执行命令:nmon_linux_x86_64 [-h] [-s ] [-c ] [-f -d -t -r ] [-x],其中,常用-s采集间隔时间,-c采集时间长度,-f输出文件格式化,-m输出文件路径
./nmon_linux_x86_64 -s10 -c60 -f -m ./nmon帮助文档
[carbondata@carbondata soft]$ ./nmon_linux_x86_64 -h

Hint: nmon_linux_x86_64 [-h] [-s <seconds>] [-c <count>] [-f -d <disks> -t -r <name>] [-x]

        -h            FULL help information
        Interactive-Mode:
        read startup banner and type: "h" once it is running
        For Data-Collect-Mode (-f)
        -f            spreadsheet output format [note: default -s300 -c288]
        optional
        -s <seconds>  between refreshing the screen [default 2]
        -c <number>   of refreshes [default millions]
        -d <disks>    to increase the number of disks [default 256]
        -t            spreadsheet includes top processes
        -x            capacity planning (15 min for 1 day = -fdt -s 900 -c 96)

Version - nmon 14g

For Interactive-Mode
        -s <seconds>  time between refreshing the screen [default 2]
        -c <number>   of refreshes [default millions]
        -g <filename> User Defined Disk Groups [hit g to show them]
                      - file = on each line: group_name <disks list> space separated
                      - like: database sdb sdc sdd sde
                      - upto 64 disk groups, 512 disks per line
                      - disks can appear more than once and in many groups
        -b            black and white [default is colour]
        example: nmon_linux_x86_64 -s 1 -c 100

For Data-Collect-Mode = spreadsheet format (comma separated values)
        Note: use only one of f,F,z,x or X and make it the first argument
        -f            spreadsheet output format [note: default -s300 -c288]
                         output file is <hostname>_YYYYMMDD_HHMM.nmon
        -F <filename> same as -f but user supplied filename
        -r <runname>  used in the spreadsheet file [default hostname]
        -t            include top processes in the output
        -T            as -t plus saves command line arguments in UARG section
        -s <seconds>  between snap shots
        -c <number>   of snapshots before nmon stops
        -d <disks>    to increase the number of disks [default 256]
        -l <dpl>      disks/line default 150 to avoid spreadsheet issues. EMC=64.
        -g <filename> User Defined Disk Groups (see above) - see BBBG & DG lines
        -N            include NFS Network File System
        -I <percent>  Include process & disks busy threshold (default 0.1)
                      don't save or show proc/disk using less than this percent
        -m <directory> nmon changes to this directory before saving to file
        example: collect for 1 hour at 30 second intervals with top procs
                 nmon_linux_x86_64 -f -t -r Test1 -s30 -c120

        To load into a spreadsheet:
        sort -A *nmon >stats.csv
        transfer the stats.csv file to your PC
        Start spreadsheet & then Open type=comma-separated-value ASCII file
         The nmon analyser or consolidator does not need the file sorted.

Capacity planning mode - use cron to run each day
        -x            sensible spreadsheet output for CP =  one day
                      every 15 mins for 1 day ( i.e. -ft -s 900 -c 96)
        -X            sensible spreadsheet output for CP = busy hour
                      every 30 secs for 1 hour ( i.e. -ft -s 30 -c 120)

Interactive Mode Commands
        key --- Toggles to control what is displayed ---
        h   = Online help information
        r   = Machine type, machine name, cache details and OS version + LPAR
        c   = CPU by processor stats with bar graphs
        l   = long term CPU (over 75 snapshots) with bar graphs
        m   = Memory stats
        L   = Huge memory page stats
        V   = Virtual Memory and Swap stats
        k   = Kernel Internal stats
        n   = Network stats and errors
        N   = NFS Network File System
        d   = Disk I/O Graphs
        D   = Disk I/O Stats
        o   = Disk I/O Map (one character per disk showing how busy it is)
        o   = User Defined Disk Groups
        j   = File Systems
        t   = Top Process stats use 1,3,4,5 to select the data & order
        u   = Top Process full command details
        v   = Verbose mode - tries to make recommendations
        b   = black and white mode (or use -b option)
        .   = minimum mode i.e. only busy disks and processes

        key --- Other Controls ---
        +   = double the screen refresh time
        -   = halves the screen refresh time
        q   = quit (also x, e or control-C)
        0   = reset peak counts to zero (peak = ">")
        space = refresh screen now

Startup Control
        If you find you always type the same toggles every time you start
        then place them in the NMON shell variable. For example:
         export NMON=cmdrvtan

Others:
        a) To you want to stop nmon - kill -USR2 <nmon-pid>
        b) Use -p and nmon outputs the background process pid
        c) To limit the processes nmon lists (online and to a file)
           Either set NMONCMD0 to NMONCMD63 to the program names
           or use -C cmd:cmd:cmd etc. example: -C ksh:vi:syncd
        d) If you want to pipe nmon output to other commands use a FIFO:
           mkfifo /tmp/mypipe
           nmon -F /tmp/mypipe &
           grep /tmp/mypipe
        e) If nmon fails please report it with:
           1) nmon version like: 14g
           2) the output of cat /proc/cpuinfo
           3) some clue of what you were doing
           4) I may ask you to run the debug version

        Developer Nigel Griffiths
        Feedback welcome - on the current release only and state exactly the problem
        No warranty given or implied.
四.性能数据分析
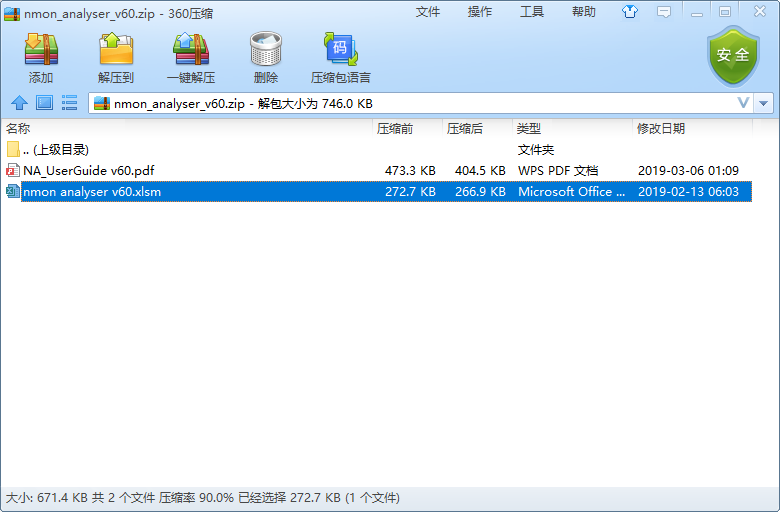
1.解压需要的文件nmon analyser v60.xlsm
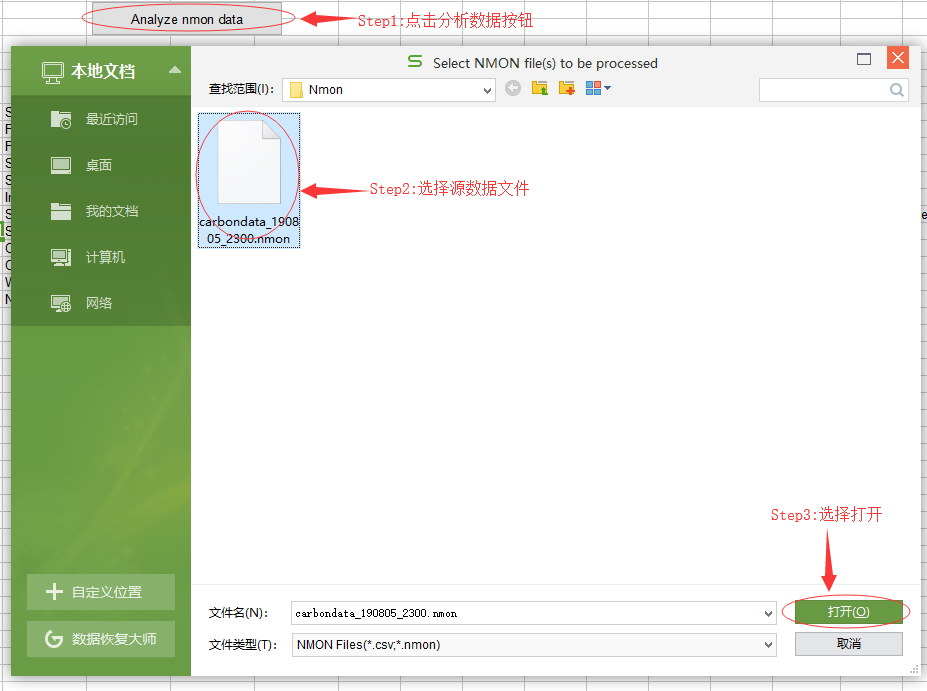
2.使用nmon analyser v60.xlsm将源数据文件转为.xlsx文件
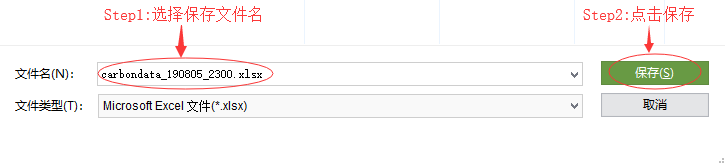
3.转换并保存
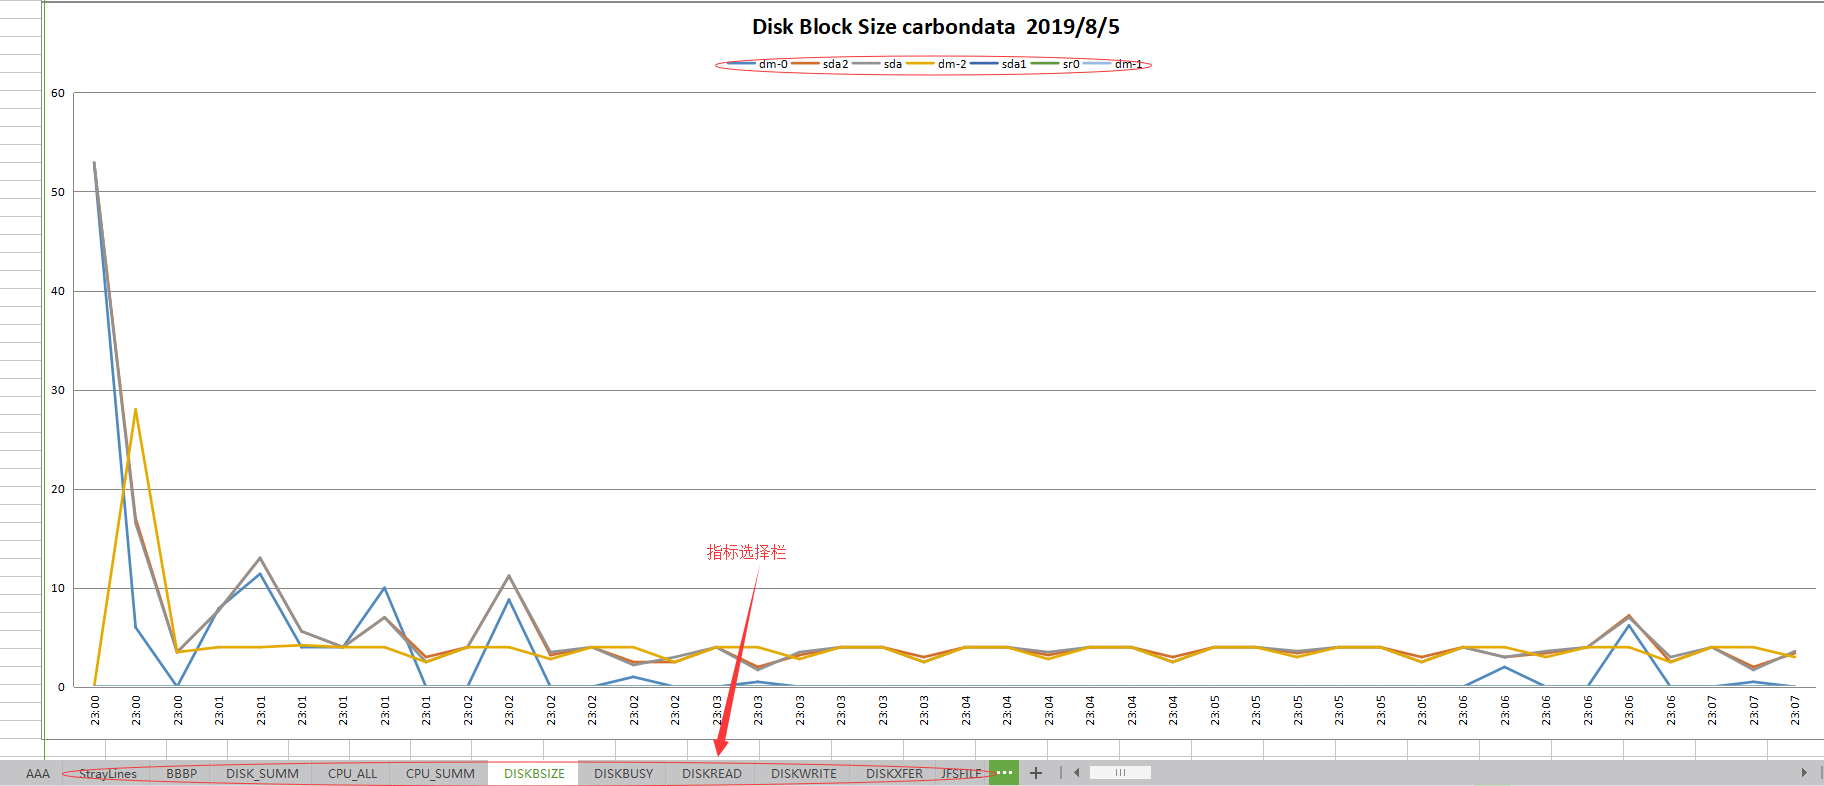
4.性能指标查看
主要查看指标包括:CPU使用情况、磁盘I/O、内存使用情况、网络使用情况等
五.问题
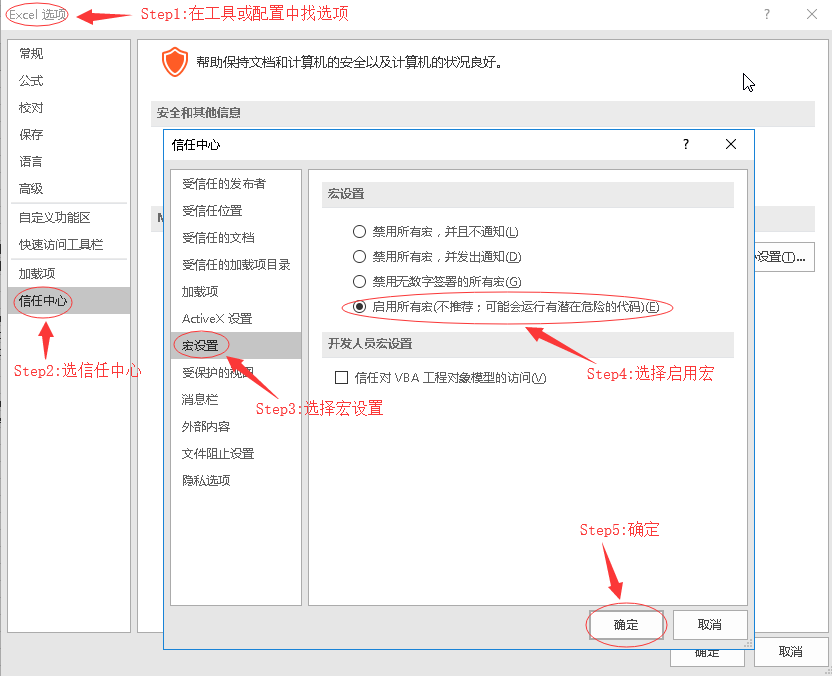
1.打开nmon analyser v60.xlsm时 宏 的问题
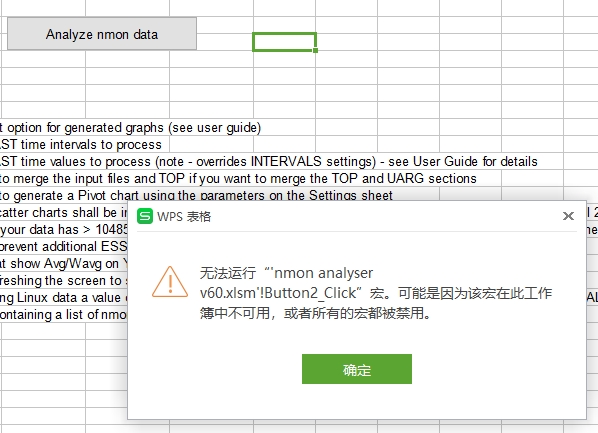
a).WPS
下载WPS的vba模块
百度云盘: https://pan.baidu.com/s/1R4lSyDZ2HkspHT4fBfSE8w
提取码:abwr
b).Office