文章首发于公众号《程序员果果》
地址 : https://mp.weixin.qq.com/s/BjZyNcWEgflJMnjfceiluw
简介
Prometheus 是一套开源的系统监控报警框架。它启发于 Google 的 borgmon 监控系统,由工作在 SoundCloud 的 google 前员工在 2012 年创建,作为社区开源项目进行开发,并于 2015 年正式发布。
特点
作为新一代的监控框架,Prometheus 具有以下特点:
-
强大的多维度数据模型:
- 时间序列数据通过 metric 名和键值对来区分。
- 所有的 metrics 都可以设置任意的多维标签。
- 数据模型更随意,不需要刻意设置为以点分隔的字符串。
- 可以对数据模型进行聚合,切割和切片操作。
- 支持双精度浮点类型,标签可以设为全 unicode。
- 灵活而强大的查询语句(PromQL):在同一个查询语句,可以对多个 metrics 进行乘法、加法、连接、取分数位等操作。
- 易于管理: Prometheus server 是一个单独的二进制文件,可直接在本地工作,不依赖于分布式存储。
- 高效:平均每个采样点仅占 3.5 bytes,且一个 Prometheus server 可以处理数百万的 metrics。
使用 pull 模式采集时间序列数据,这样不仅有利于本机测试而且可以避免有问题的服务器推送坏的 metrics。 - 可以采用 push gateway 的方式把时间序列数据推送至 Prometheus server 端。
- 可以通过服务发现或者静态配置去获取监控的 targets。
- 有多种可视化图形界面。
- 易于伸缩。
组成及架构
Prometheus 生态圈中包含了多个组件,其中许多组件是可选的:
- Prometheus Server: 用于收集和存储时间序列数据。
- Client Library: 客户端库,为需要监控的服务生成相应的 metrics 并暴露给 Prometheus server。当 Prometheus server 来 pull 时,直接返回实时状态的 metrics。
- Push Gateway: 主要用于短期的 jobs。由于这类 jobs 存在时间较短,可能在 Prometheus 来 pull 之前就消失了。为此,这次 jobs 可以直接向 Prometheus server 端推送它们的 metrics。这种方式主要用于服务层面的 metrics,对于机器层面的 metrices,需要使用 node exporter。
- Exporters: 用于暴露已有的第三方服务的 metrics 给 Prometheus。
- Alertmanager: 从 Prometheus server 端接收到 alerts 后,会进行去除重复数据,分组,并路由到对收的接受方式,发出报警。常见的接收方式有:电子邮件,pagerduty,OpsGenie, webhook 等。
- 一些其他的工具。
下图为 Prometheus 官方文档中的架构图:
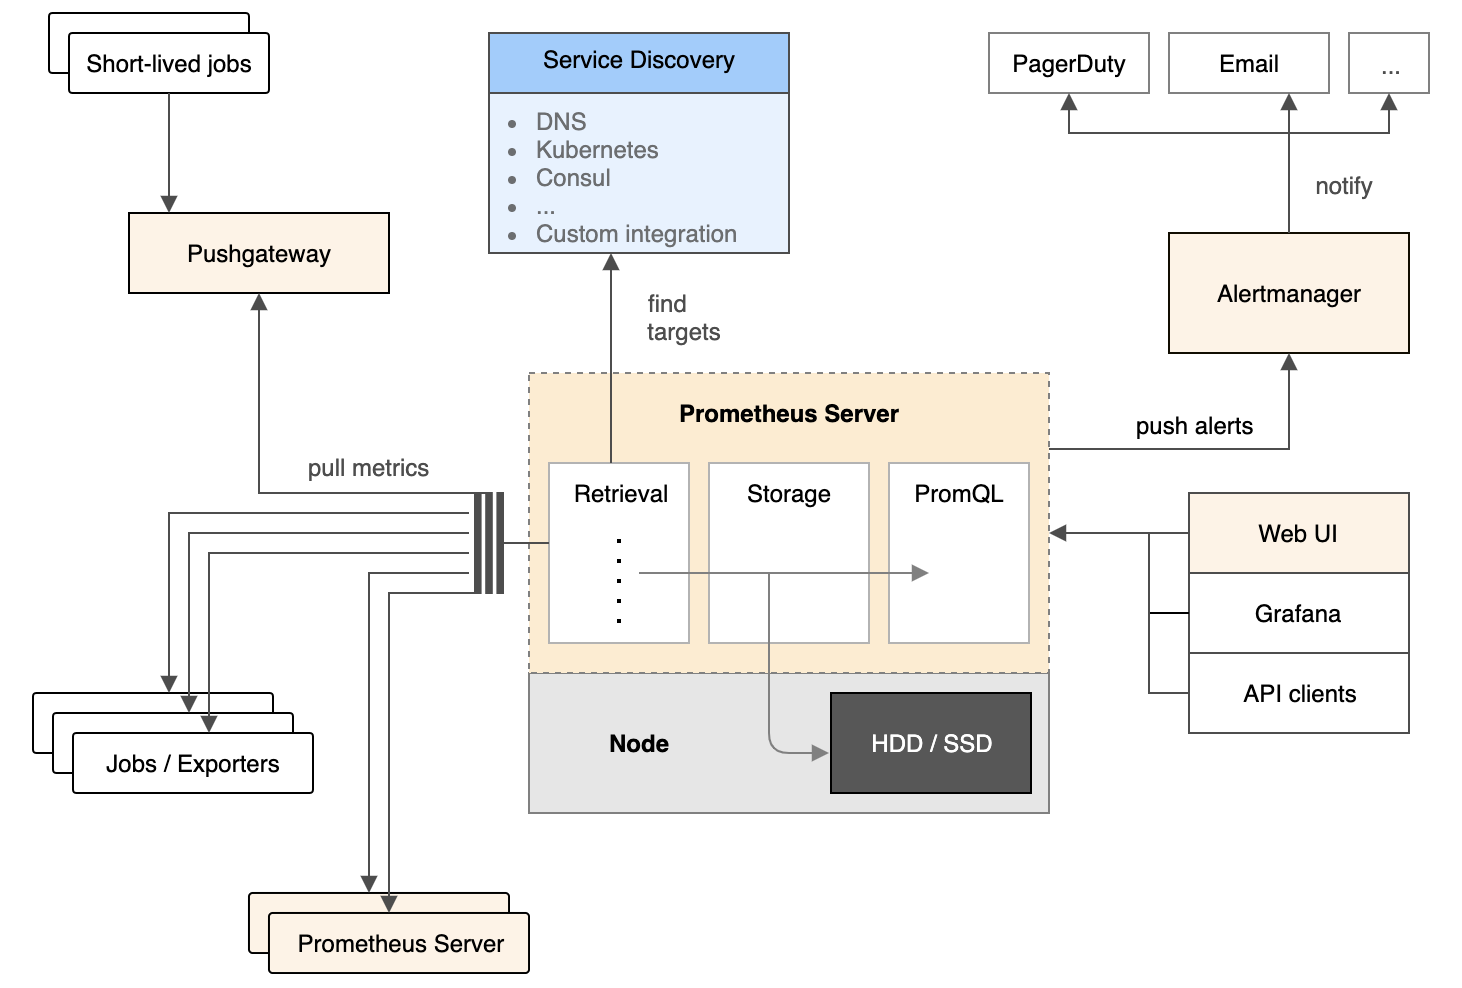
从上图可以看出,Prometheus 的主要模块包括:Prometheus server, exporters, Pushgateway, PromQL, Alertmanager 以及图形界面。
其大概的工作流程是:
- Prometheus server 定期从配置好的 jobs 或者 exporters 中拉 metrics,或者接收来自Pushgateway 发过来的 metrics,或者从其他的 Prometheus server 中拉 metrics。
- Prometheus server 在本地存储收集到的 metrics,并运行已定义好的 alert.rules,记录新的时间序列或者向 Alertmanager 推送警报。
- Alertmanager 根据配置文件,对接收到的警报进行处理,发出告警。
在图形界面中,可视化采集数据。
相关概念
下面将对 Prometheus 中的数据模型(时间序列),metric 类型,instance 和 jobs等概念进行介绍。
数据模型
Prometheus 中存储的数据为时间序列,是由 metric 的名字和一系列的标签(键值对)唯一标识的,不同的标签则代表不同的时间序列。
- metric 名字:该名字应该具有语义,一般用于表示 metric 的功能,例如:http_requests_ total, 表示 http 请求的总数。其中,metric 名字由 ASCII 字符,数字,下划线,以及冒号组成,且必须满足正则表达式 a-zA-Z_:*。
- 标签:使同一个时间序列有了不同维度的识别。例如 http_requests_total{method="Get"} 表示所有 http 请求中的 Get 请求。当 method="post" 时,则为新的一个 metric。标签中的键由 ASCII 字符,数字,以及下划线组成,且必须满足正则表达式 a-zA-Z_:*。
- 样本:实际的时间序列,每个序列包括一个 float64 的值和一个毫秒级的时间戳。
- 格式:{=, …},例如:http_requests_total{method="POST",endpoint="/api/tracks"}。
Metrics种类
Prometheus客户端库提供了四种核心Metrics类型。
Counter(计数器)
- 说明:Counter是一个累积度量,它表示一个单调递增的 Metrics,其值只能在重启时递增或重置为零
- 场景:可以使用Counter来表示http的请求数、已完成的任务数或错误数、下单数。
Gauge(测量仪)
- 说明:当前值的一次快照(snapshot)测量,可增可减。
- 场景:磁盘使用率,当前同时在线用户数。
Histogram(直方图)
- 说明:通过区间统计样本分布。
- 场景:请求延迟时间的统计。例如统计 0~200ms、200ms~400ms、400ms~800ms 区间的请求数有多。
Summary(汇总)
- 说明:根据样本统计出百分位。
- 场景:请求延迟时间的统计。例如统计 95%的请求延迟 < xxx ms ,99%的请求延迟 < xxx ms
instance 和 jobs
在Prometheus术语中,你可以scrape(刮擦)的端点称为 实例,通常对应于单个进程。一组同种类型的 instances(主要用于保证可扩展性和可靠性),例如:具有四个复制instances(实例)的API服务器job作业:
-
job: api-server
- instance 1: 1.2.3.4:5670
- instance 2: 1.2.3.4:5671
- instance 3: 5.6.7.8:5670
- instance 4: 5.6.7.8:5671
当Prometheus scrape(刮擦)目标时,它会自动在scrape的时间序列上附加一些标签,用来识别scrape的目标。
- job:目标所属的已配置job名称。
- instance::已刮擦的目标URL 的一部分。
对于每次实例 scrape(刮取,Prometheus都会在以下时间序列中存储样本:
- up{job="<job-name>", instance="<instance-id>"}:1如果实例是健康的,即可达,或者0刮擦失败。
- scrape_duration_seconds{job="<job-name>", instance="<instance-id>"}:刮擦持续时间。
- scrape_samples_post_metric_relabeling{job="<job-name>", instance="<instance-id>"}:应用度量标准重新标记后剩余的样本数。
- scrape_samples_scraped{job="<job-name>", instance="<instance-id>"}:目标暴露的样本数。
- scrape_series_added{job="<job-name>", instance="<instance-id>"}:该刮擦中新系列的大致数量。v2.10中的新功能。
up时间序列对于实例可用性监视非常有用。
安装和配置
安装
你可以在官网 https://prometheus.io/download/ 下载 安装包,解压后使用。为了方便,我使用docker 镜像的方式 运行Prometheus。
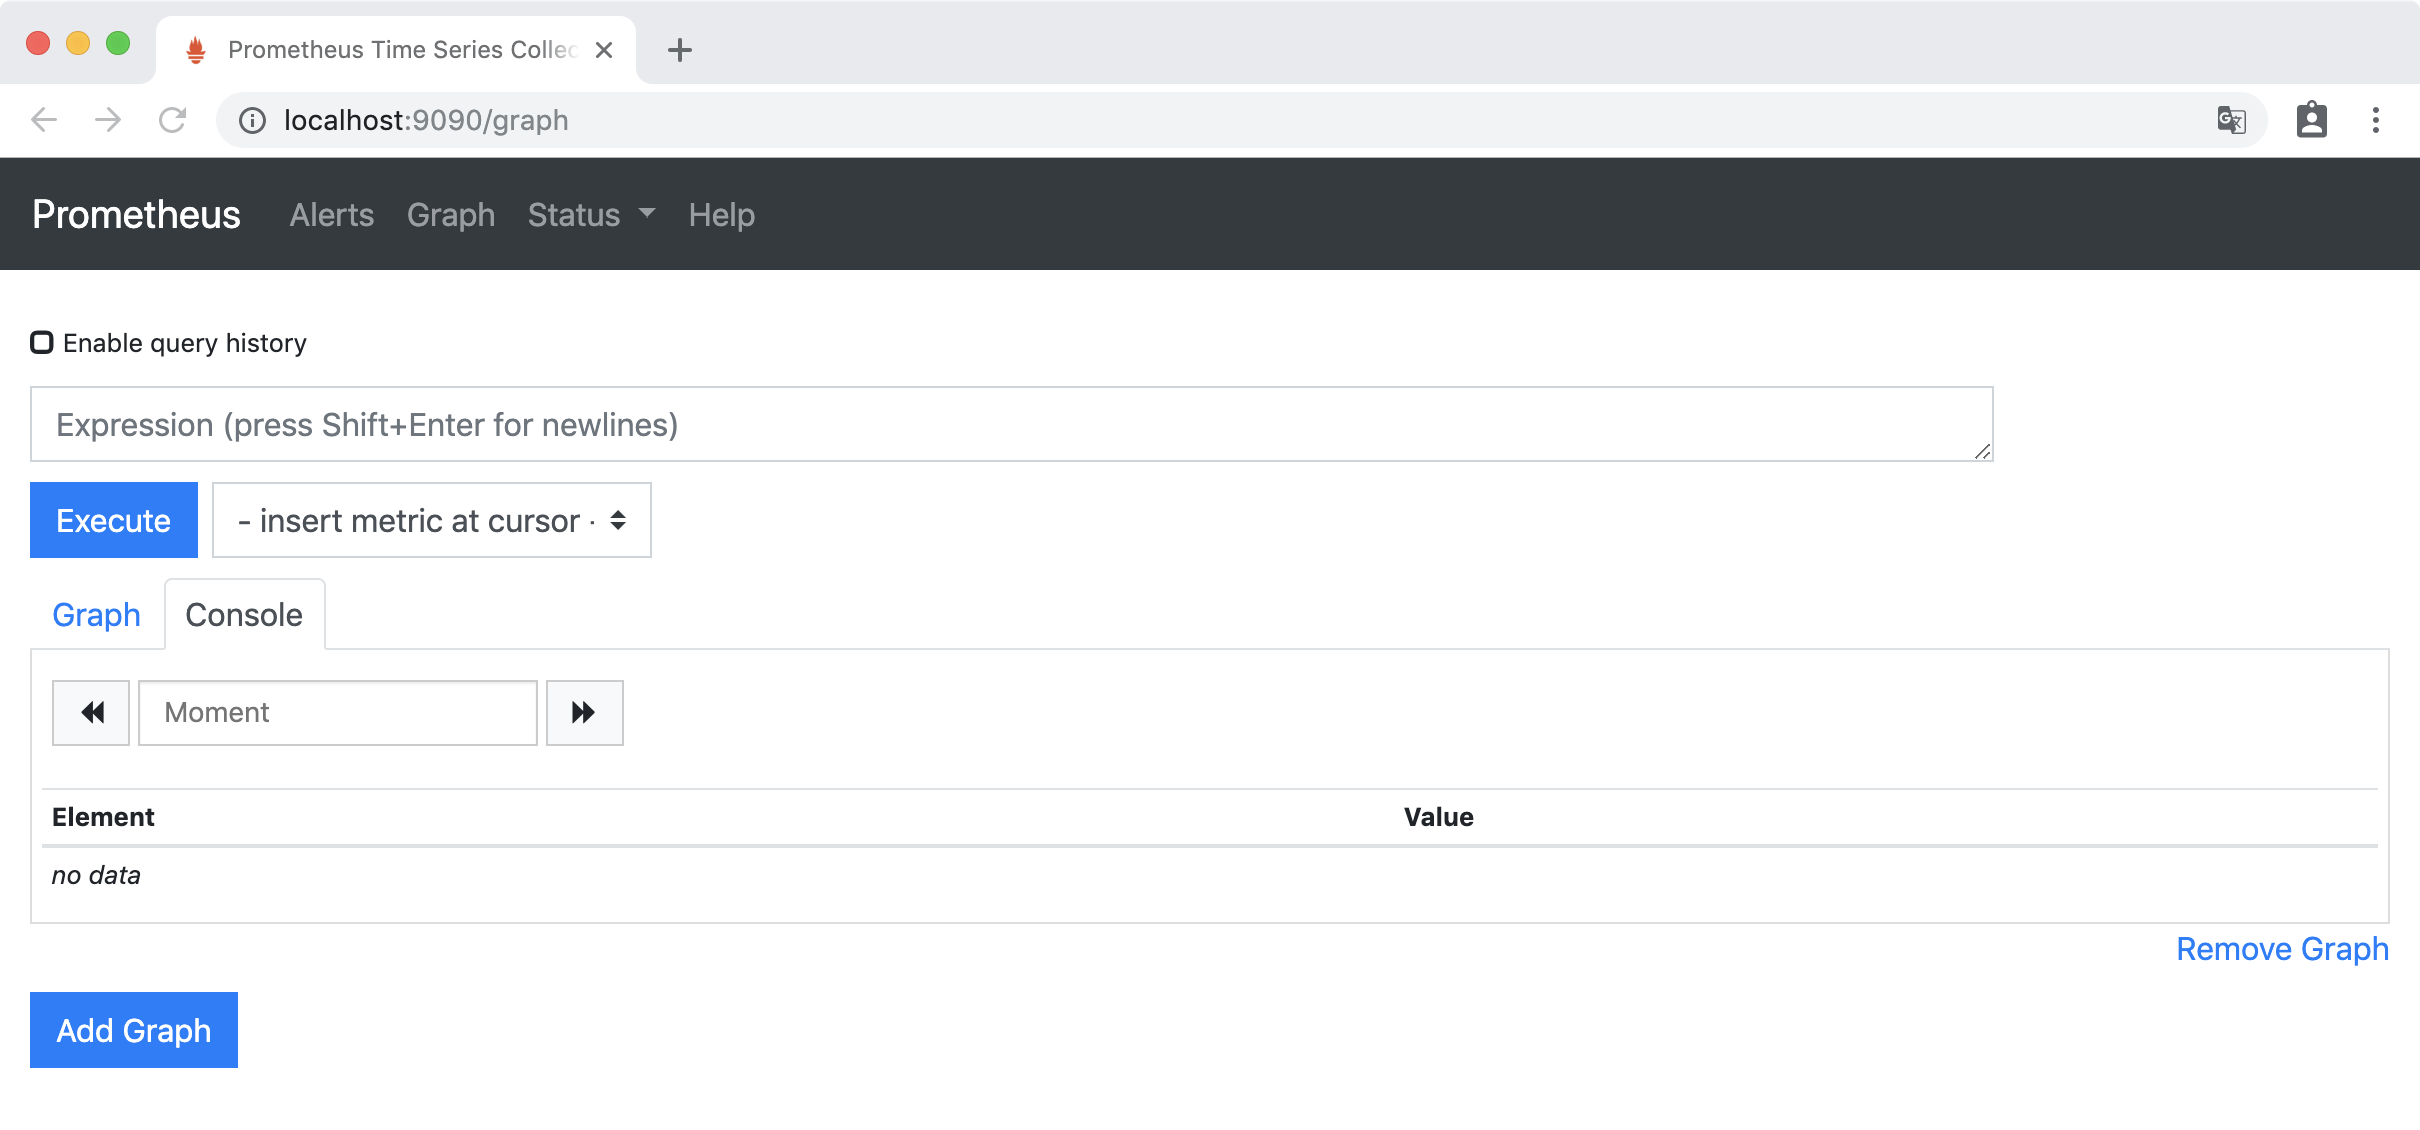
docker run --name prometheus -d -p 9090:9090 prom/prometheus浏览器输入http://localhost:9090 ,访问 Prometheus 的 Web UI:
点击菜单栏 “Status” 下的 Targets ,界面如下:
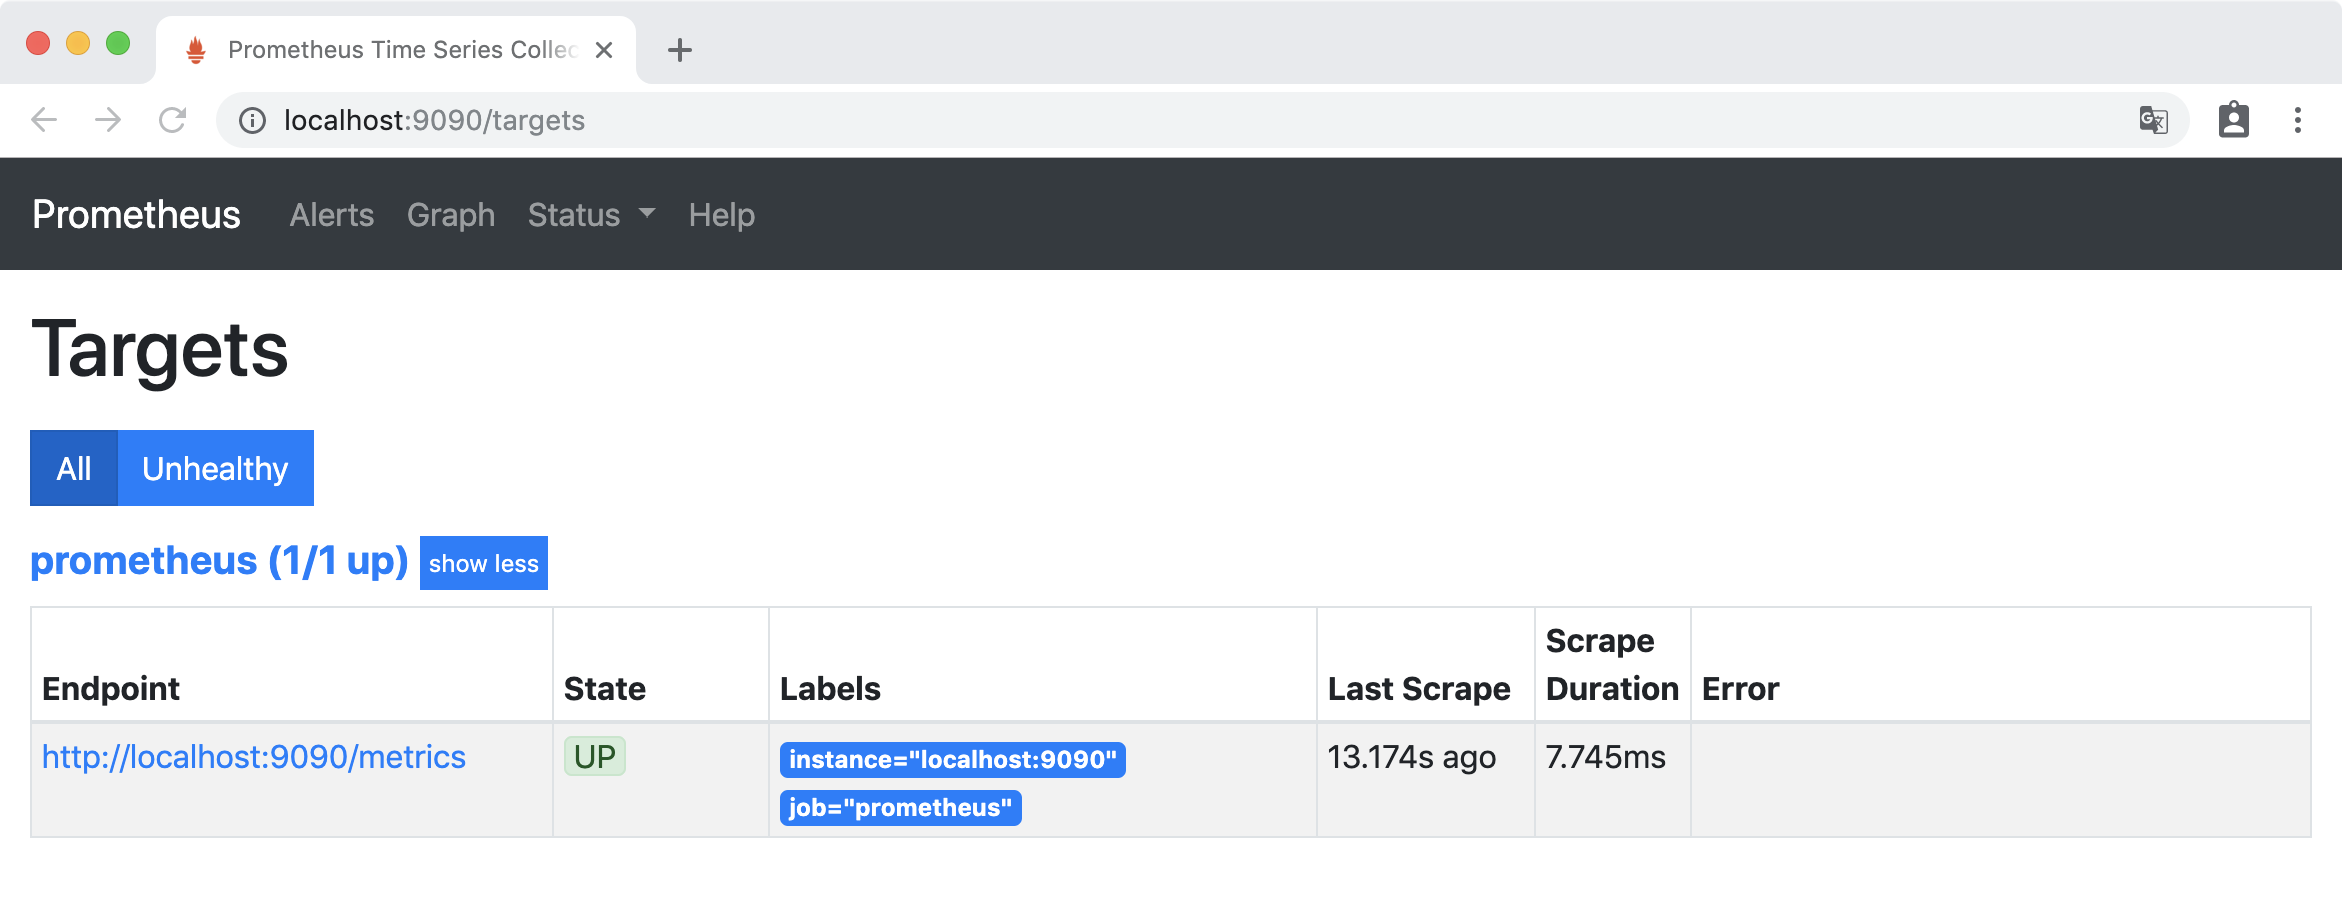
可以看大Prometheus 自身 metrics 处于UP状态 ,说明 安装成功。
配置
Prometheus 的配置文件 prometheus.yml 内容如下:
# 全局设置,可以被覆盖
global:
  scrape_interval:     15s
  evaluation_interval: 15s

rule_files:
  # - "first.rules"
  # - "second.rules"

scrape_configs:
  - job_name: prometheus
    static_configs:
- targets: ['localhost:9090']该global块控制 Prometheus 的全局配置。我们有两种选择。第一个,scrape_interval控制Prometheus 刮擦目标的频率。你可以为单个目标覆盖此值。在这种情况下,全局设置是每15秒刮一次。该evaluation_interval选项控制普罗米修斯评估规则的频率。Prometheus 使用规则创建新的时间序列并生成警报。
该rule_files块指定我们希望 Prometheus 加载的任何规则的位置。现在我们没有规则。
最后一个块scrape_configs控制 Prometheus 监视的资源。由于 Prometheus 还将自己的数据公开为HTTP端点,因此它可以抓取并监控自身的健康状况。在默认配置中有一个名为 prometheus 的job,它抓取 prometheus 服务器 公开的时间序列数据。该作业包含一个静态配置的目标,即端口9090上的本地主机。返回的时间序列数据将详细说明Prometheus服务器的状态和性能。
实验
Prometheus HTTP 度量模拟器
为了演示 Prometheus 的简单使用,这里运行一个 Prometheus HTTP 度量模拟器。模拟一个简单的HTTP微服务,生成Prometheus Metrics,通过 docker 运行。
docker run -p 8080:8080 pierrevincent/prom-http-simulator:0.1它在/metrics端点下公开以下Prometheus指标:
- http_requests_total:请求计数器,标签endpoint和status
- http_request_duration_milliseconds:请求延迟直方图
可以开启流量高峰模式,更改流量高峰模式可以通过以下方式完成:
# ON
curl -X POST http://127.0.0.1:8080/spike/on

# OFF
curl -X POST http://127.0.0.1:8080/spike/off

# RANDOM
curl -X POST http://127.0.0.1:8080/spike/random
错误率默认为1%。它可以更改为0到100之间的数字:
# 例如将错误率设置为50%
curl -H 'Content-Type: application/json' -X PUT -d '{"error_rate": 50}' http://127.0.0.1:8080/error_rate
修改Prometheus配置
需要将 HTTP 度量模拟器 的 metrics端点 配置到 Prometheus的配置文件 prometheus.yml 中。
创建一个 prometheus.yml 文件 内容如下:
global:
  scrape_interval: 5s
  evaluation_interval: 5s
  scrape_timeout: 5s

scrape_configs:
  - job_name: 'prometheus'
    static_configs:
    - targets: ['localhost:9090']
  - job_name: 'http-simulator'
    metrics_path: /metrics
    static_configs:
- targets: ['172.16.1.232:8080']通过docker up 命令替换 容器中的配置文件:
docker cp prometheus.yml prometheus:/etc/prometheus/重启容器:
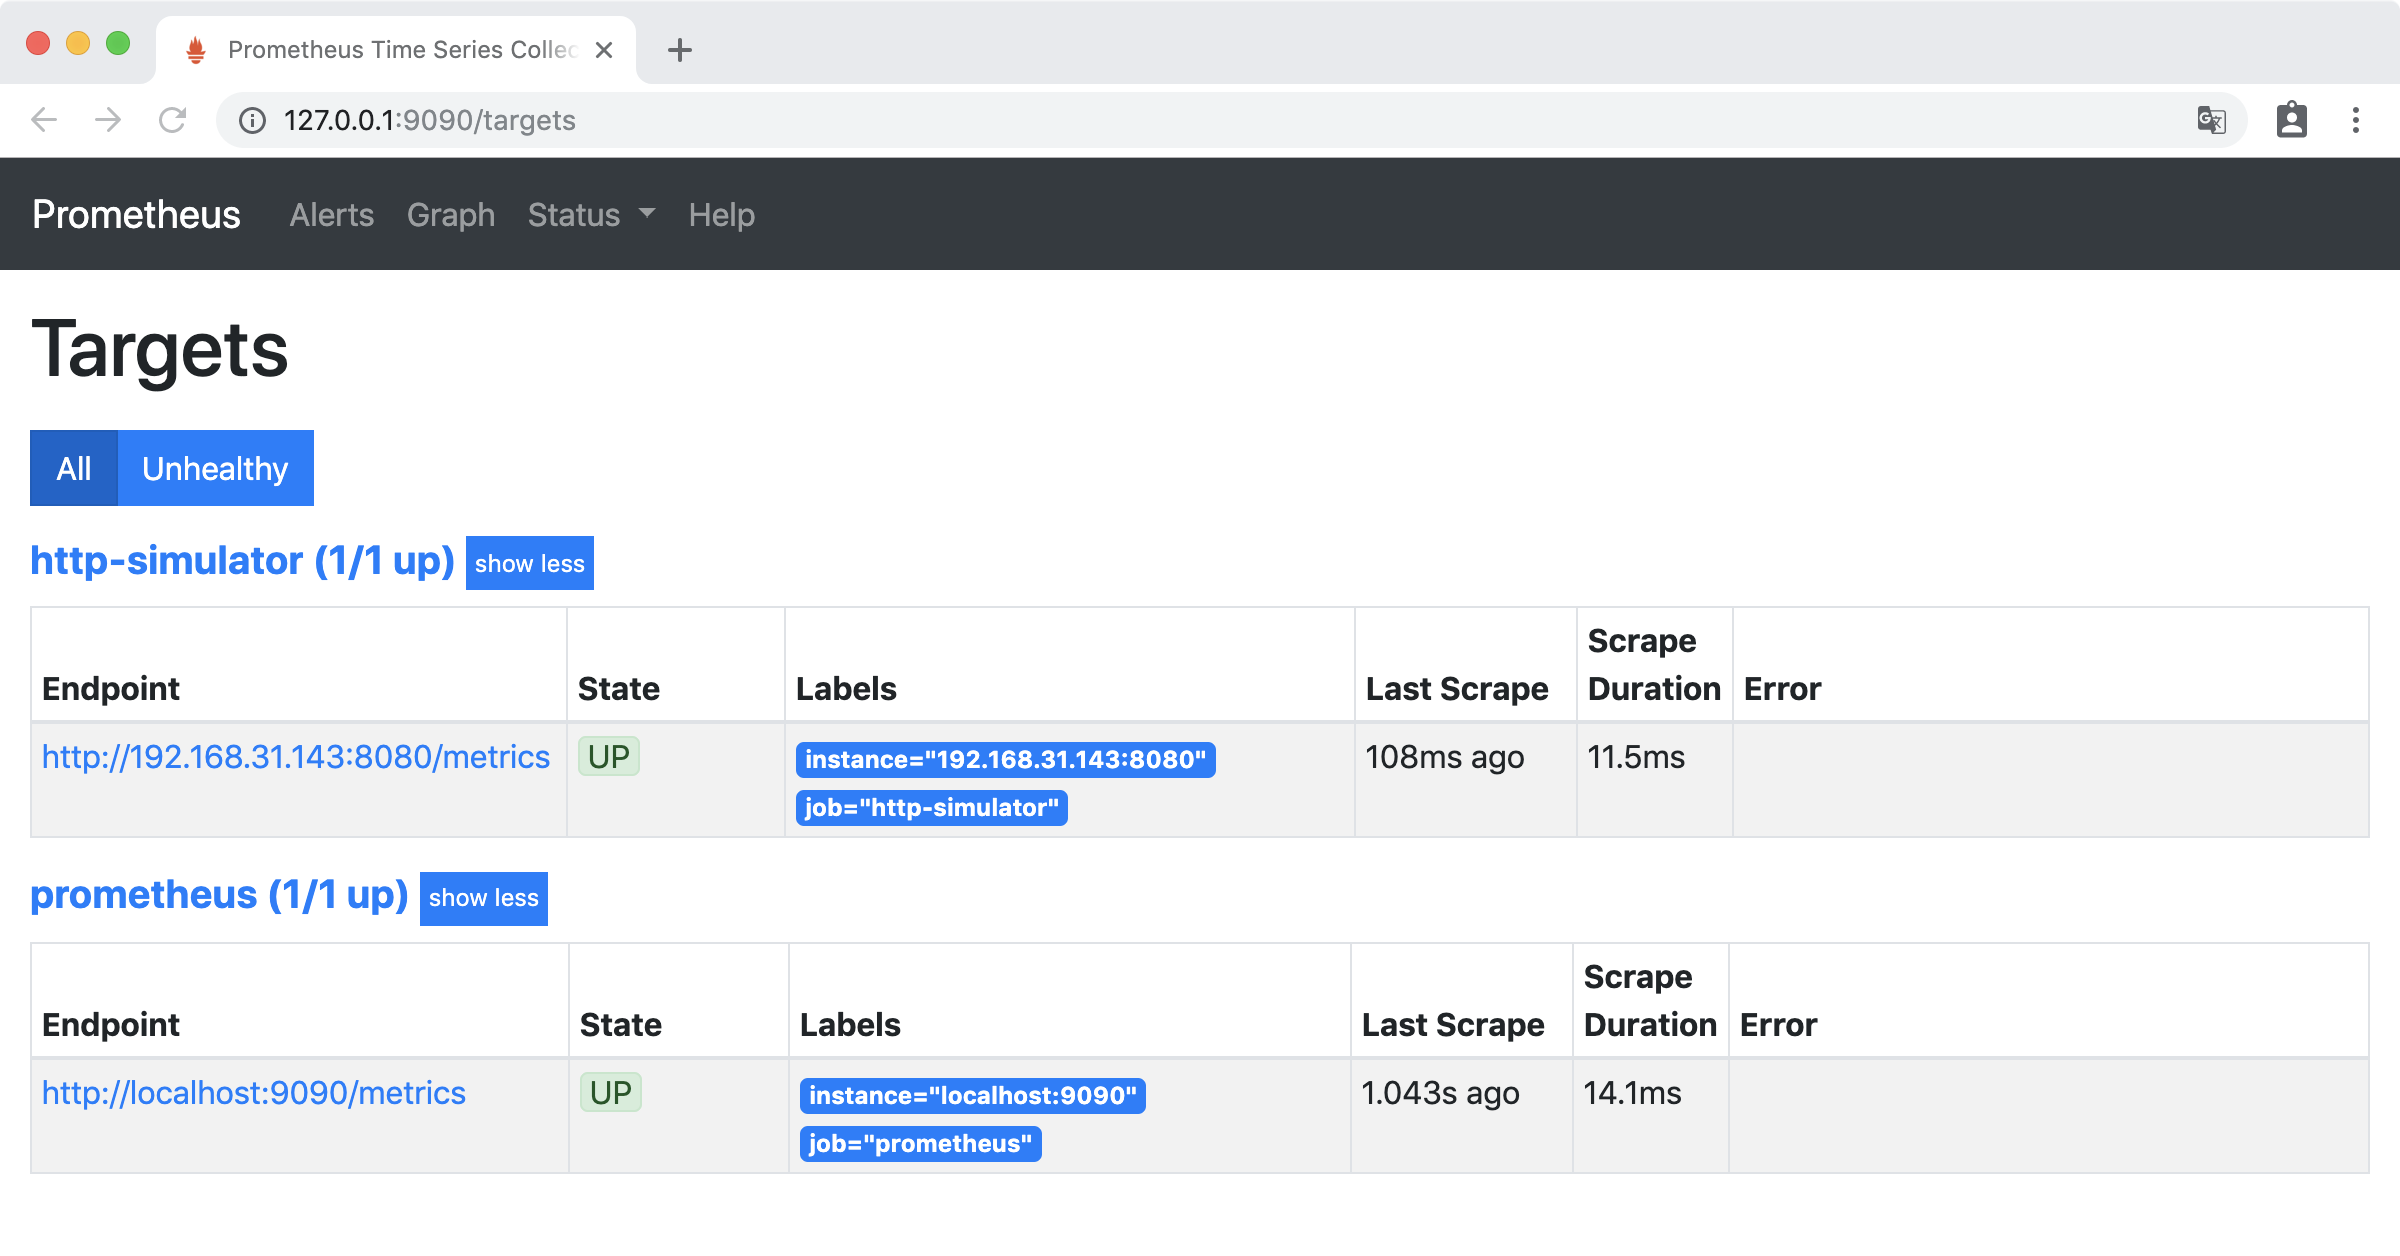
docker restart prometheus访问 http://localhost:9090/targets ,发现已经出现了 target “http-simulator” ,并且为UP状态。
查询
请求率(Request Rate)查询
查询http请求数
http_requests_total{job="http-simulator"}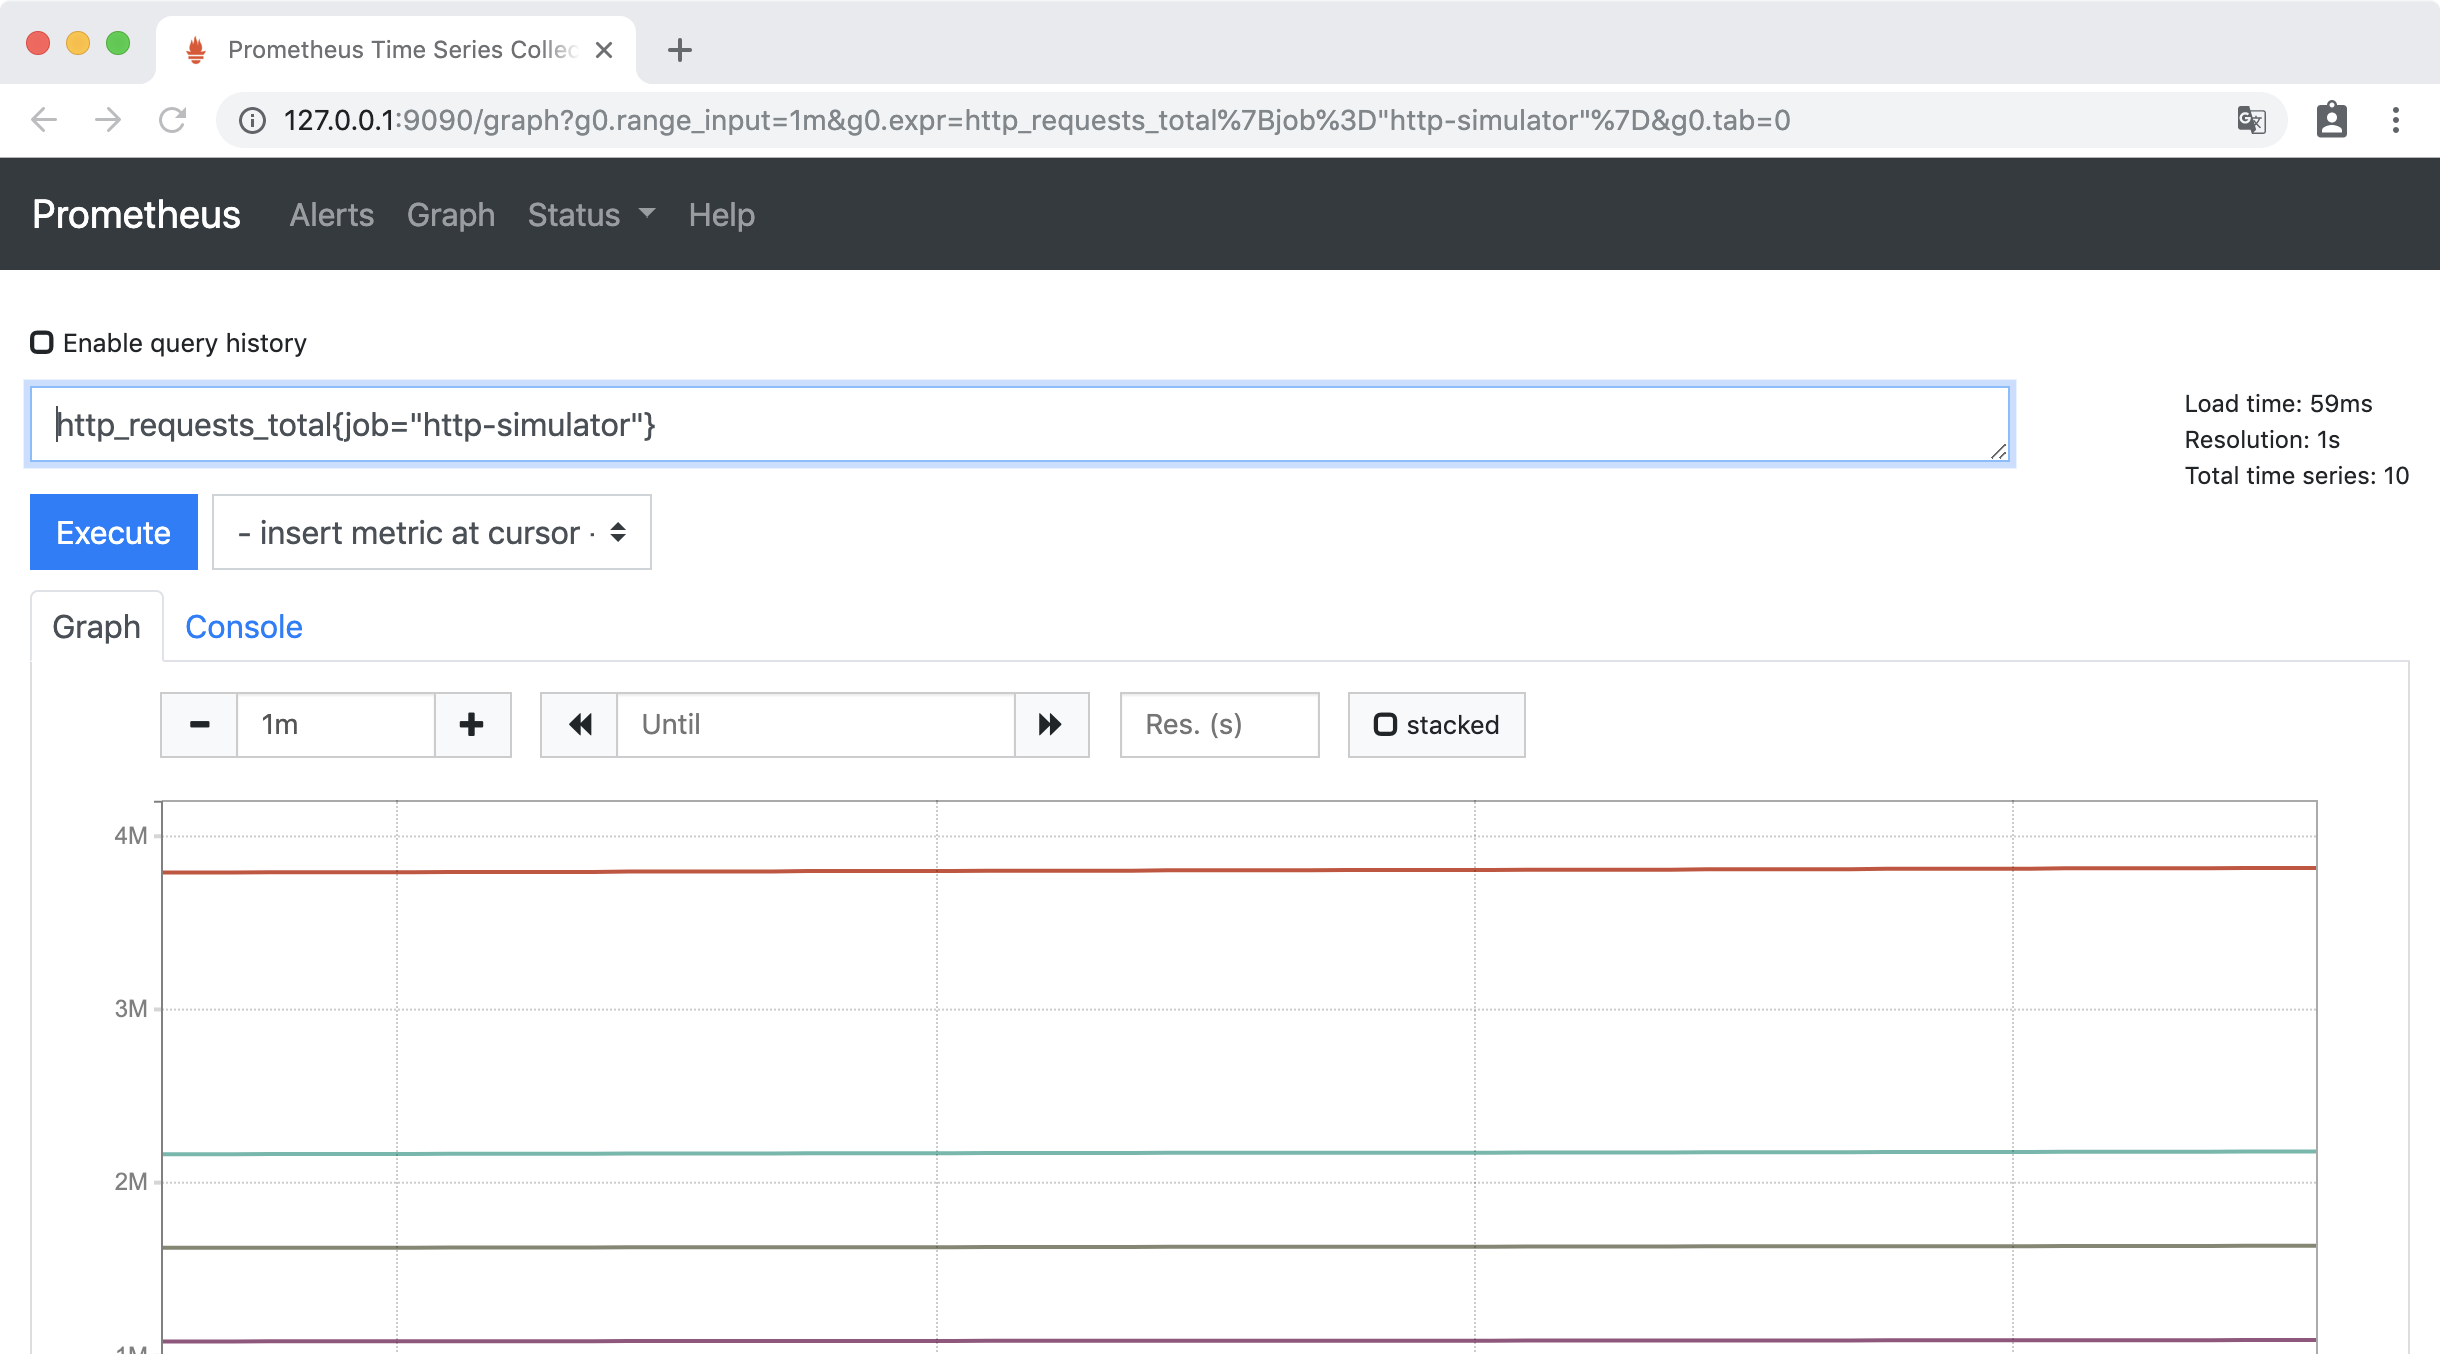
查询成功login请求数
http_requests_total{job="http-simulator", status="200", endpoint="/login"}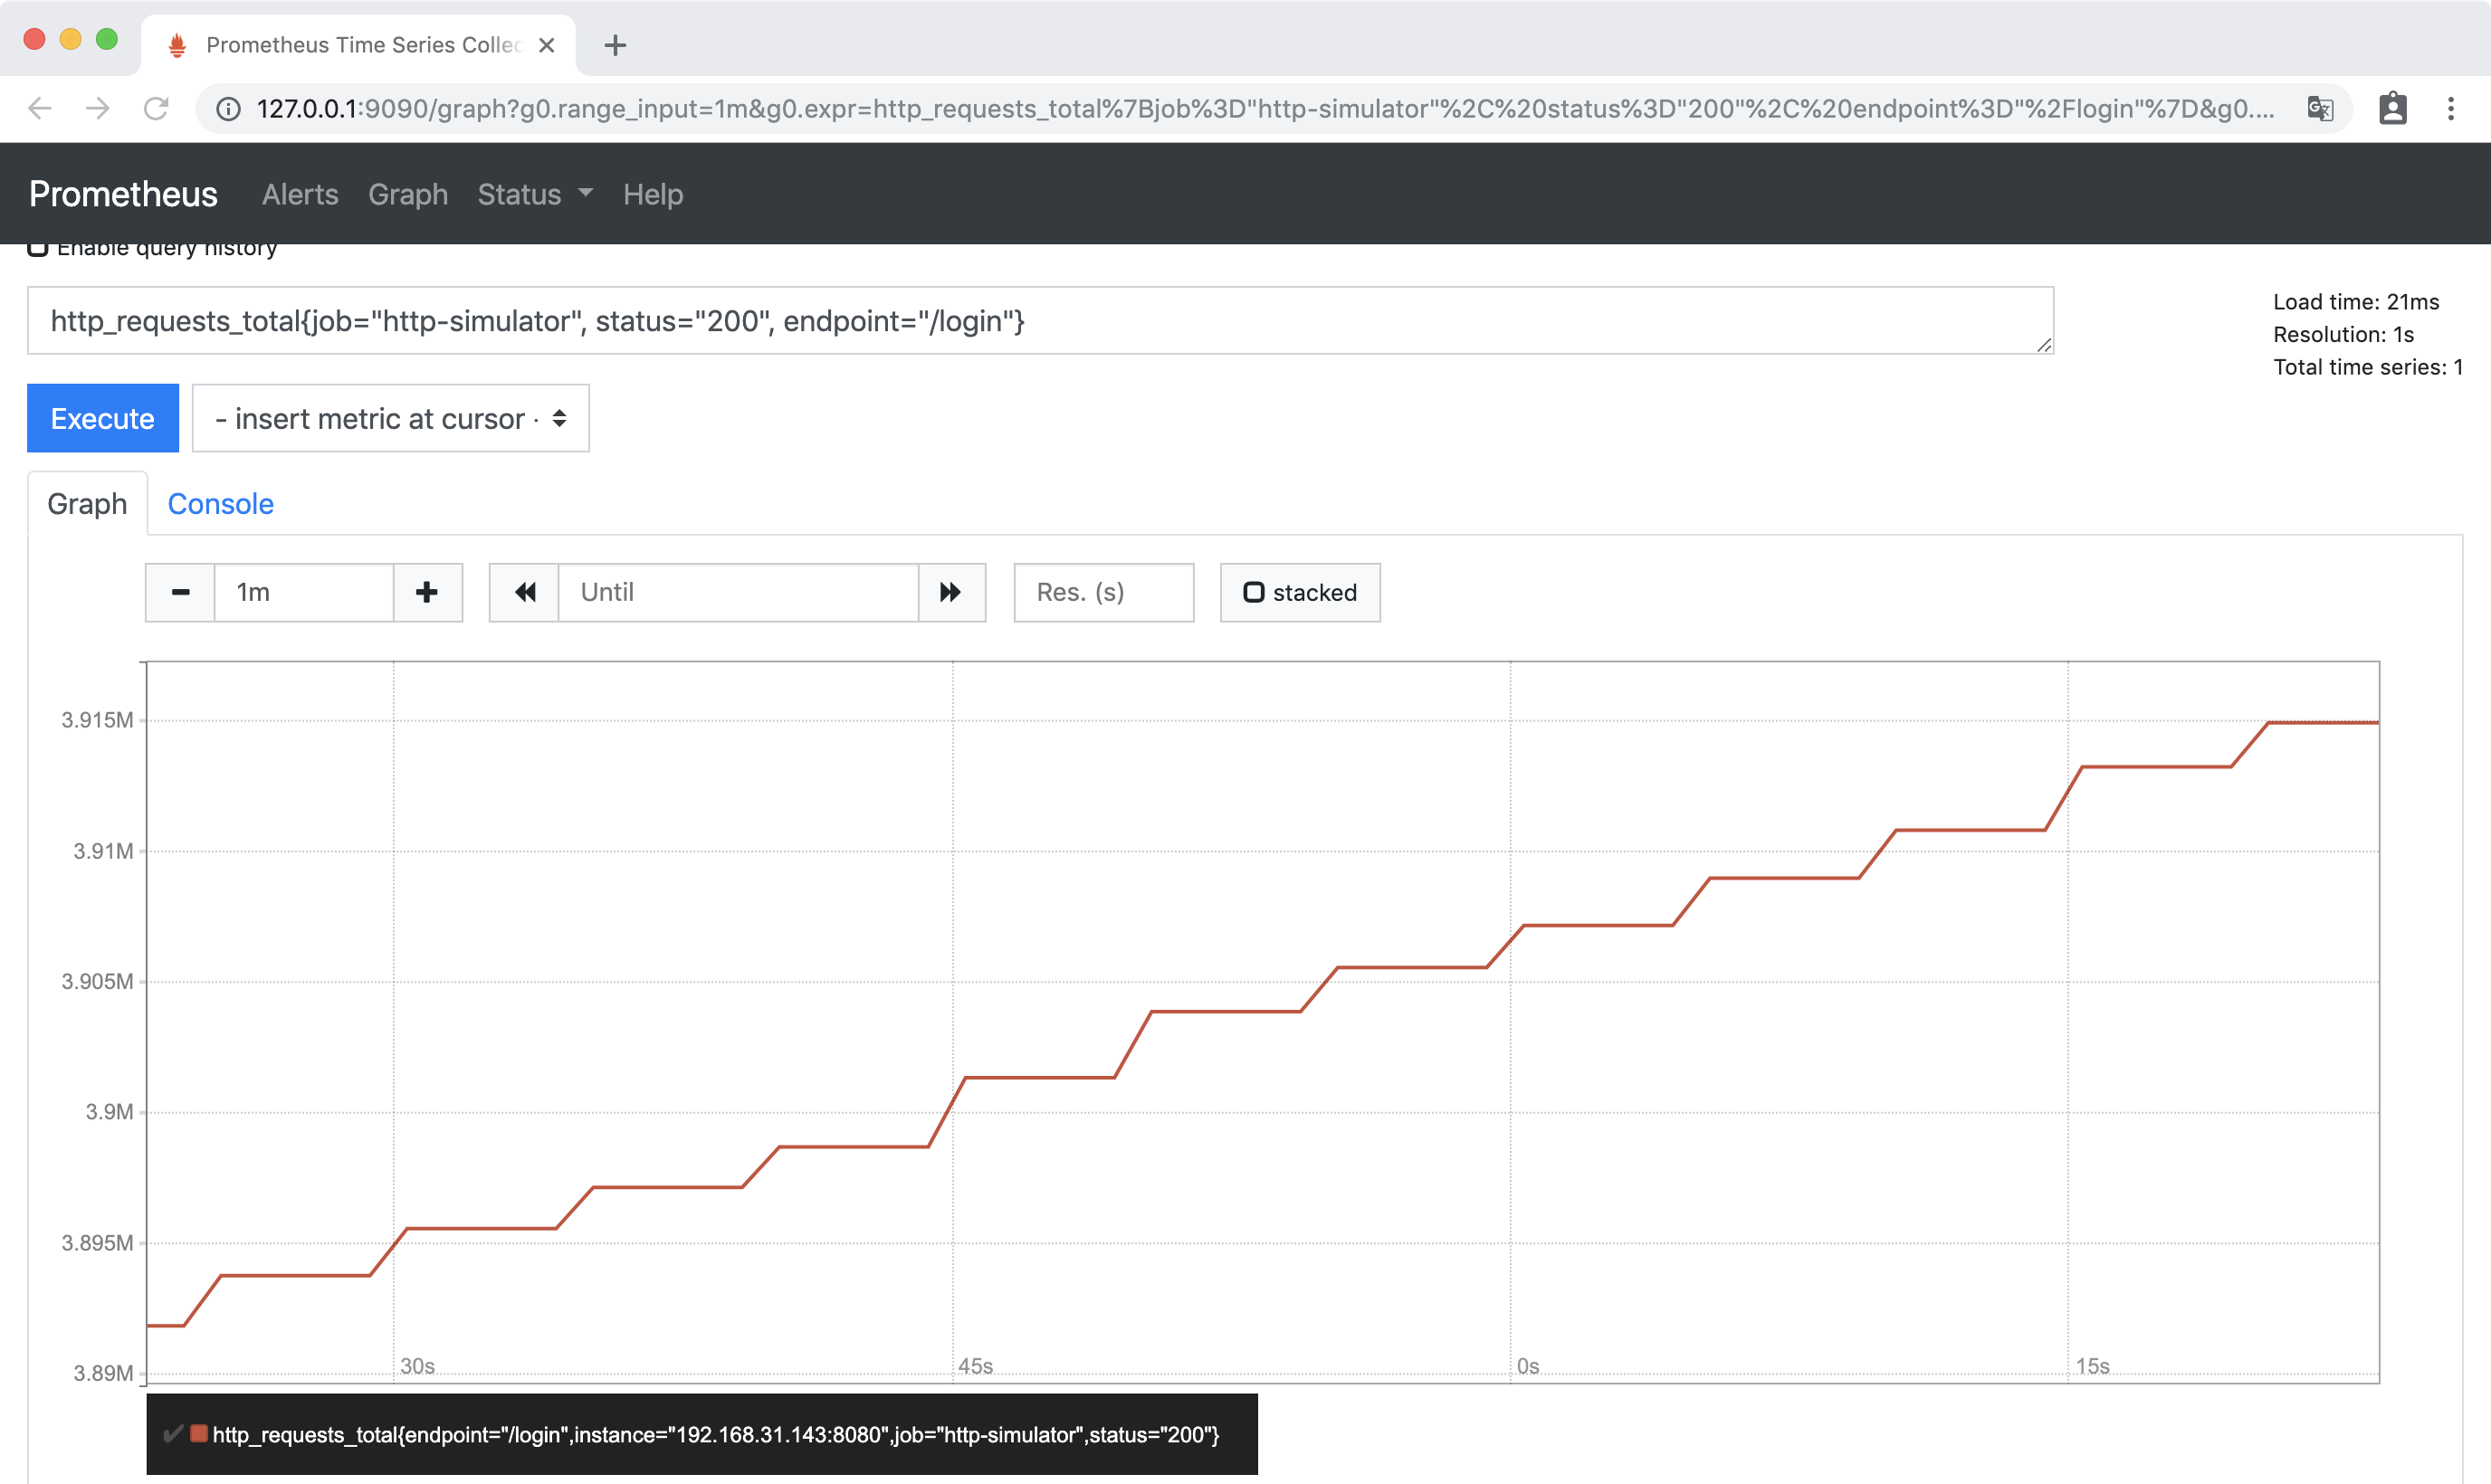
查询成功请求数,以endpoint区分
http_requests_total{job="http-simulator", status="200"}查询总成功请求数
sum(http_requests_total{job="http-simulator", status="200"})查询成功请求率,以endpoint区分
rate(http_requests_total{job="http-simulator", status="200"}[5m])查询总成功请求率
sum(rate(http_requests_total{job="http-simulator", status="200"}[5m]))延迟分布(Latency distribution)查询
查询http-simulator延迟分布
http_request_duration_milliseconds_bucket{job="http-simulator"}查询成功login延迟分布
http_request_duration_milliseconds_bucket{job="http-simulator", status="200", endpoint="/login"}不超过200ms延迟的成功login请求占比
sum(http_request_duration_milliseconds_bucket{job="http-simulator", status="200", endpoint="/login", le="200"}) / sum(http_request_duration_milliseconds_count{job="http-simulator", status="200", endpoint="/login"})成功login请求延迟的99百分位
histogram_quantile(0.99, rate(http_request_duration_milliseconds_bucket{job="http-simulator", status="200", endpoint="/login"}[5m]))上面给出的这些查询表达式,在 prometheus 的 查询界面上自行测试下 ,这里就不一一测试了,
总结
本篇对 Prometheus 的组成,架构和基本概念进行了介绍,并实例演示了 Prometheus 的查询表达式的应用。本篇是 Prometheus 系列的第一篇, 后续还会有Prometheus与其他图形界面的集成,与 springboot 应用的集成等 。
参考
https://prometheus.io/docs/introduction/overview/
https://www.ibm.com/developerworks/cn/cloud/library/cl-lo-prometheus-getting-started-and-practice/index.html