[I]symbols and lines
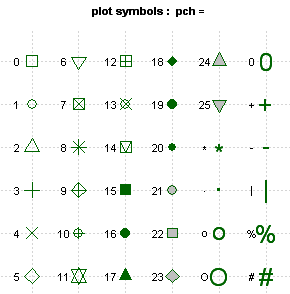
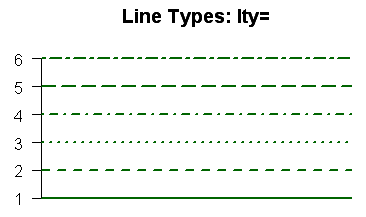
> plot(A,B,type="b",lty=3,lwd=3,pch=15,cex=2)
| Parameter |
function |
| pch |
plot point |
| cex |
symbols size,default=1 |
| lty |
lines type |
| lwd |
lines weight,default=1 |
pch #plot point
cex #symbols size,default=1
lty #lines type
lwd #lines weight,default=1

Specially,symbol 21~25,can custom border color(by col=) and fill color(by bg=)

[II]color
#Create a color match
> install.packages("RColorBrewer")
> library(RColorBrewer)
> n<-9
> mycolors<-brewer.pal(n,"Set1")
> barplot(rep(1,n),col=mycolors)
#multi-level grayscale
> n<-9
> mycolors<-rainbow(n)
> pie(rep(1,n),labels=mycolors,col=mycolors)
> mygrays<-gray(0:n/n)
> mygrays<-gray(0:n/n)
> pie(rep(1,n),labels=mygrays,col=mygrays)
| Parameter |
function |
| col |
plot color |
| col.axis |
axis scale text color |
| col.lab |
axis label color |
| col.main |
main title color |
| col.sub |
sub title color |
| fg |
foreground |
| bg |
background |
| Color |
Number |
Hex |
RGB |
| "white" |
1 |
"#FFFFFF" |
rgb(1,1,1) |
| "black" |
24 |
"#000000" |
rgb(0,0,0) |
| "bule" |
26 |
"#0000FF" |
rgb(0,0,255) |
| "brown" |
32 |
"#A52A2A" |
rgb(165,42,42) |
| "orange" |
498 |
"#FF6100" |
rgb(255,215,0) |
| "pink" |
536 |
"#FFC0CB" |
rgb(255,192,203) |
| "purpel" |
547 |
"#800080" |
rgb(128,0,128 |
| "red" |
552 |
"#FF0000" |
rgb(255,0,0) |
| "yellow" |
652 |
"#FFFF00" |
rgb(255,255,0) |
[III]text
> opar<-par(no.readonly=TRUE)
> par(font.lab=3,cex.lab=1.5,font.main=4,cex.main=2)
> par(opar)
| Parameter |
function |
| cex |
text size |
| cex.axis |
axis scale size |
| cex.lab |
axis label size |
| cex.main |
main title size |
| cex.sub |
sub title size |
| Parameter |
function |
| font |
1=Normal,2=Bold,3=Italic,4=Bold Italic,5=Symbol Font |
| font.axis |
axis scale font |
| font.lab |
axis label font |
| font.main |
main title font |
| font.sub |
sub title font |
| pa |
font value(1pound=1/72inch),font vale=ps*cex |
| family |
drawing text,value=serif/sans/mono |
[IV]graphic size and boundary size
> opar<-par(no.readonly=TRUE)
> par(pin=c(4,3),mai=c(1,5,1,2))
> par(opar)
| Parameter |
function |
| pin |
graphic size:width and height(inch) |
| mai |
boundary size:up down left right(inch) |
| mar |
boundary size:up down left right(British cent),default=c(5,4,4,2)+0.1 |
[V]title
> title(main="My Title",col.main="red",
+       sub="My Subtitle",col.sub="blue",
+       xlab="My X label",ylab="My Y label",
+       col.lab="green",cex.lab=0.75)
[VI]axis
> axis(4,at=z,labels=round(z,digits=2),col.axis="blue",las=2,cex.axis=0,7,tck=-0.1)
| Parameter |
function |
| side |
the relative position of the axis in the graph,1=down,2=left,3=up,4=right |
| at |
scale position |
| labels |
scale line text label |
| pos |
intersecting another axis position value |
| lty |
lines type |
| col |
lines and scale lines color |
| las |
0=label is parallel to the coordinate axis,2=label is perpendicular to the axis |
| tck |
0=disable scale,1=plot grid lines,default=-0.01 |
[VII]reference line
> abline(h=c(1,5,7),v=seq(1,10,2),lty=2,col="bule")
[VIII]legend
> legend("top;eft",inset=.0.5,title="Music Type",c("A","B"),lty=c(1,2),pch=c(15,17),col=c("red","bule"))
| Parameter |
function |
| location |
legend positon,bottom,bottomleft,left,topleft,top,topright,right,bottomright,center |
| title |
legend title string |
| legend |
legend label string vector |
[IX]text annotation
> text(age,ID,row.names(singerdata),cex=0.6,pos=4,col="red")
| Parameter |
function |
| location |
text position |
| pos |
relative position of text,1=down,2=left,3=up,4=right,offset can be set |
| side |
text side,1=down,2=left,3=up,4=right,adj=0:align left bottom,adj=1:align right bottom |
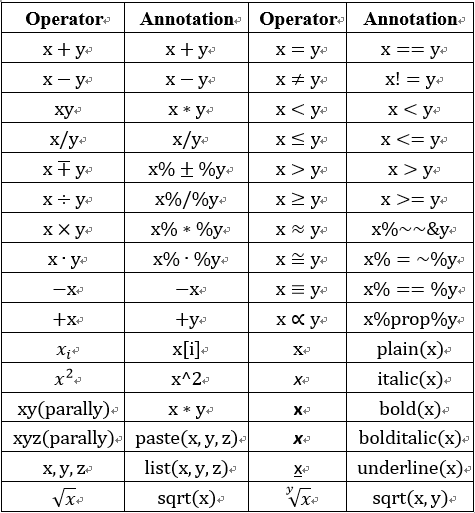
math annotation

[X]graphics combination
#par()
> par(mfrow=c(2,2))
#layout()
> layout(matrix(c(1,1,2,3),2,2,byrow=TRUE),widths=c(3,1),heights=c(1,2))
[XI]ggplot2
1.specify the type of graph with a geometry function
| Function |
Add |
Option |
| geom_bar() |
bar chart |
color,fill,alpha |
| geom_boxplot() |
box plot |
color,fill,alpha,notch,width |
| geom_density() |
density plot |
color,fill,alpha,linetype |
| geom_histogram() |
histogram |
color,fill,alpha,linetype,binwidth |
| geom_hline() |
horizontal line |
| geom_jitter() |
jitter point |
color,size,alpha,shape |
| geom_line() |
line plot |
colorvalpha,linetype,size |
| geom_point() |
scatter plot |
color,alpha,shape,size |
| geom_rug() |
carpet plot |
color,side |
| geom_smooth() |
curve fitting |
method,formula,color,fill,linetype,size |
| geom_text() |
text annotation |
reference to "help" |
| geom_violin() |
violin picture |
color,fill,alpha,linetype |
| geom_vline() |
perpendicular |
color,alpha,linetype,size |
2.grouping
> data(Salaries,package="car")
> library(ggplot2)
> ggplot(data=Salaries,aes(x=salary,fill=rank)) + geom_density(alpha=,3)

> ggplot(Salaries,aes(x=yrs,.since.phd,y=salary,color=rank,shape=sex))+geom_point()
> ggplot(Salaries,aes(x=rank,fill=sex)) + geom_bar(position="stack")+ labs(title='position="stack"')
> ggplot(Salaries,aes(x=rank,fill=sex)) + geom_bar(position="dodge")+ labs(title='position="dodge"')
> ggplot(Salaries,aes(x=rank,fill=sex)) + geom_bar(position="fill")+ labs(title='position="fill"')
> ggplot(Salaries,aes(x=rank,fill=sex)) + geom_bar()
> ggplot(Salaries,aes(x=rank)) + geom_bar(fill="red")
> ggplot(Salaries,aes(x=rank,fill="red‘’)) + geom_bar()
3.characterize
| Grammar |
Result |
| facet_wrap(~var,ncol=n) |
arrange each var horizontally into an independent map of n columns |
| facet_wrap(~var,nrow=n) |
arrange each var horizontally into an independent map of n rows |
| facet_grid(rowvar~colvar) |
independent plot of rowvar and colvar |
| facet_grid(rowvar~.) |
independent plot of each rowvar level,configured as a single column |
| facet_grid(.~colvar) |
independent plot of each column level,configured as a single row |
4.add a smooth curve
| Option |
Description |
| method= |
default=smooth;lm,smooth,rlm,gam |
| formula= |
y~x(default),y~log(x),y~poly(x,n),y~ns(x,n) |
| se |
draw a confidence interval,default=TRUE |
| level |
confidence interval level used,default=95% |
| fullrange |
default=FALSE:just data;TRUE:the fit should cover the full picture |
5.appearance
(1)axis
| Functions |
Option |
| scale_x_continuous()&scale_y_continuous |
break,label,limits,=specified |
| scale_x_discrete()&scale_y_discrete() |
break,label,limits,=level |
| coord_flip() |
reverse the x and the y axes |
(2)legend
> data(Salaries,package="car")
> library(ggplot2)
> ggplot(data=Salaries,aes(x=rank,y=salary,fill=sex)) + geom_boxplot() +
            scale_x_discrete(breaks=c("AsstProf"),"AssocProf","Porf"),
            labels=c("Assistant\nProfessor","Associate\nProfessor","Full\nProfessor"))+
            scale_y_continuous(break=c(50000,100000,150000,200000),
            lables=c("$50K","$100K","$150K","$200k"))+
            labs(title="Faculty Salary by Rank and Gender",x="",y="",fill="Gender")+
            theme(legend.position=c(.1,.8))
(3)ruler
> ggplot(mtcars,aes(x=wt,y=mpg,size=disp))+geom_point(shape=21,color="black",fill="cornsilk")+
            labs(x="Weight",y="Miles Per Gallon",title="Bubble Chart",size="Engine\nDisplacement")
> data(Salaries,package="car")
> ggplot(data=Salaries,aes(x=yrs.since.phd,y=salary,color=rank))+
             scale_color_manual(values=c("orange","olivedrab","navy"))+geom_point(size=2)
> ggplot(data=Salaries,aes(x=yrs.since.phd,y=salary,color=rank))+
             scale_color_brewer(palette="Set1")+geom_point(size=2)
> library(RColorBrewer)
> display.brewer.all()
(4)theme
> data(Salaries,package="car")
> library(ggplot2)
> mytheme<-theme(plot.title=element_text(face="bold.italic",size="14",color="brown"),
                            axis.title=element_text(face="bold.italic",size=10,color="brown"),
                            axis.text=element_text(face="bold",size=9,color="darkblue"),
                            panel.background=element_rect(fill="white",color="darkblue"),
                            panel.grid.major.y=element_line(color="grey",linetype=1),
                            panel.grid.minor.y=element_line(color="grey",linetype=2),
                            panel.grid.minor.x=element_blank(),legend.position="top")

> ggplot(Salaries,aes(x=rank,y=salary,fill=sex))+geom_boxplot()+
            labs(title="Salary by Rank and Sex",x='Rank",y="Salary")+mytheme
(5)multiple map
> data(Salaries,package="car")
> library(ggplot2)
> p1<-ggplot(data=Salaries,aes(x=rank))+geom_bar()
> p2<-ggplot(data=Salaries,aes(x=sex))+geom_bar()
> p3<-ggplot(data=Salaries,aes(x=yrs.since.phd,y=salary))+geom_point()
> library(gridExtra)
> grid.arrange(p1,p2,p3,ncol=3)
5.save
> myplot<-ggplot(data=mtcars,aes(x=mpg))+geom_histogtam()
> ggsave(file="mygraph.png",plot=myplot,withd=5,height=4)

> ggplot(data=mtcars,aes(x=mpg))+geom_histogram()
> ggsave(file="mygraph.pdf")
END!


