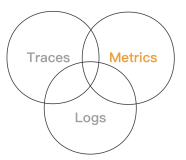
metrcis输出
collector.go
package main

import (
	"github.com/prometheus/client_golang/prometheus"
)

//Define a struct for you collector that contains pointers
//to prometheus descriptors for each metric you wish to expose.
//Note you can also include fields of other types if they provide utility
//but we just won't be exposing them as metrics.
type fooCollector struct {
	fooMetric *prometheus.Desc
	barMetric *prometheus.Desc
}

//You must create a constructor for you collector that
//initializes every descriptor and returns a pointer to the collector
func newFooCollector() *fooCollector {
	return &fooCollector{
		fooMetric: prometheus.NewDesc("foo_metric",
			"Shows whether a foo has occurred in our cluster",
			nil, nil,
		),
		barMetric: prometheus.NewDesc("bar_metric",
			"Shows whether a bar has occurred in our cluster",
			nil, nil,
		),
	}
}

//Each and every collector must implement the Describe function.
//It essentially writes all descriptors to the prometheus desc channel.
func (collector *fooCollector) Describe(ch chan<- *prometheus.Desc) {

	//Update this section with the each metric you create for a given collector
	ch <- collector.fooMetric
	ch <- collector.barMetric
}

//Collect implements required collect function for all promehteus collectors
func (collector *fooCollector) Collect(ch chan<- prometheus.Metric) {

	//Implement logic here to determine proper metric value to return to prometheus
	//for each descriptor or call other functions that do so.
	var metricValue float64
	if 1 == 1 {
		metricValue = 1
	}

	//Write latest value for each metric in the prometheus metric channel.
	//Note that you can pass CounterValue, GaugeValue, or UntypedValue types here.
	ch <- prometheus.MustNewConstMetric(collector.fooMetric, prometheus.CounterValue, metricValue)
	ch <- prometheus.MustNewConstMetric(collector.barMetric, prometheus.CounterValue, metricValue)

}
http输出
main.go
package main

import (
  "net/http"

  log "github.com/Sirupsen/logrus"
  "github.com/prometheus/client_golang/prometheus"
  "github.com/prometheus/client_golang/prometheus/promhttp"
)

func main() {

  //Create a new instance of the foocollector and
  //register it with the prometheus client.
  foo := newFooCollector()
  prometheus.MustRegister(foo)

  //This section will start the HTTP server and expose
  //any metrics on the /metrics endpoint.
  http.Handle("/metrics", promhttp.Handler())
  log.Info("Beginning to serve on port :8080")
  log.Fatal(http.ListenAndServe(":8080", nil))
}
单文件
package main

import (
	log "github.com/Sirupsen/logrus"
	"github.com/prometheus/client_golang/prometheus"
	"github.com/prometheus/client_golang/prometheus/promhttp"
	"net/http"
)

//Define a struct for you collector that contains pointers
//to prometheus descriptors for each metric you wish to expose.
//Note you can also include fields of other types if they provide utility
//but we just won't be exposing them as metrics.
type fooCollector struct {
	fooMetric *prometheus.Desc
	barMetric *prometheus.Desc
}

//You must create a constructor for you collector that
//initializes every descriptor and returns a pointer to the collector
func newFooCollector() *fooCollector {
	return &fooCollector{
		fooMetric: prometheus.NewDesc("fff_metric",
			"Shows whether a foo has occurred in our cluster",
			nil, nil,
		),
		barMetric: prometheus.NewDesc("bbb_metric",
			"Shows whether a bar has occurred in our cluster",
			nil, nil,
		),
	}
}

//Each and every collector must implement the Describe function.
//It essentially writes all descriptors to the prometheus desc channel.
func (collector *fooCollector) Describe(ch chan<- *prometheus.Desc) {

	//Update this section with the each metric you create for a given collector
	ch <- collector.fooMetric
	ch <- collector.barMetric
}

//Collect implements required collect function for all promehteus collectors
func (collector *fooCollector) Collect(ch chan<- prometheus.Metric) {

	//Implement logic here to determine proper metric value to return to prometheus
	//for each descriptor or call other functions that do so.
	var metricValue float64
	if 1 == 1 {
		metricValue = 1
	}

	//Write latest value for each metric in the prometheus metric channel.
	//Note that you can pass CounterValue, GaugeValue, or UntypedValue types here.
	ch <- prometheus.MustNewConstMetric(collector.fooMetric, prometheus.CounterValue, metricValue)
	ch <- prometheus.MustNewConstMetric(collector.barMetric, prometheus.CounterValue, metricValue)

}

func main() {

	//Create a new instance of the foocollector and
	//register it with the prometheus client.
	foo := newFooCollector()
	prometheus.MustRegister(foo)

	//This section will start the HTTP server and expose
	//any metrics on the /metrics endpoint.
	http.Handle("/metrics", promhttp.Handler())
	log.Info("Beginning to serve on port :8080")
	log.Fatal(http.ListenAndServe(":8080", nil))
}


