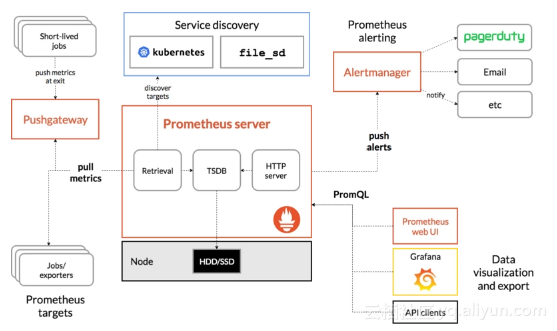
Prometheus之于kubernetes(监控领域),如kubernetes之于容器编排。
随着heapster不再开发和维护以及influxdb 集群方案不再开源,heapster+influxdb的监控方案,只适合一些规模比较小的k8s集群。而prometheus整个社区非常活跃,除了官方社区提供了一系列高质量的exporter, 例如node_exporter等。Telegraf(集中采集metrics) + prometheus的方案,也是一种减少部署和管理各种exporter工作量的很好的方案。
今天主要讲讲我司在使用prometheus过程中,存储方面的一些实战经验。
Prometheus 储存瓶颈
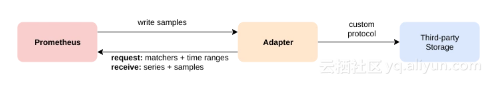
prometheus通过下面两种方式来实现与其他的远端存储系统对接
- Prometheus 按照标准的格式将metrics写到远端存储
- prometheus 按照标准格式从远端的url来读取metrics
metrics的持久化的意义和价值
其实监控不仅仅是体现在可以实时掌握系统运行情况,及时报警这些。而且监控所采集的数据,在以下几个方面是有价值的
- 资源的审计和计费。这个需要保存一年甚至多年的数据的。
- 故障责任的追查
- 后续的分析和挖掘,甚至是利用AI,可以实现报警规则的设定的智能化,故障的根因分析以及预测某个应用的qps的趋势,提前HPA等,当然这是现在流行的AIOPS范畴了。
Prometheus 数据持久化方案
方案选型
社区中支持prometheus远程读写的方案
- AppOptics: write
- Chronix: write
- Cortex: read and write
- CrateDB: read and write
- Elasticsearch: write
- Gnocchi: write
- Graphite: write
- InfluxDB: read and write
- OpenTSDB: write
- PostgreSQL/TimescaleDB: read and write
- SignalFx: write
- clickhouse: read and write
选型方案需要具备以下几点
- 满足数据的安全性,需要支持容错,备份
- 写入性能要好,支持分片
- 技术方案不复杂
- 用于后期分析的时候,查询语法友好
- grafana读取支持,优先考虑
- 需要同时支持读写
基于以上的几点,clickhouse满足我们使用场景。
Clickhouse是一个高性能的列式数据库,因为侧重于分析,所以支持丰富的分析函数。
下面是Clickhouse官方推荐的几种使用场景:
- Web and App analytics
- Advertising networks and RTB
- Telecommunications
- E-commerce and finance
- Information security
- Monitoring and telemetry
- Time series
- Business intelligence
- Online games
- Internet of Things
ck适合用于存储Time series
此外社区已经有graphouse项目,把ck作为Graphite的存储。
性能测试
写入测试
本地mac,docker 启动单台ck,承接了3个集群的metrics,均值达到12910条/s。写入毫无压力。其实在网盟等公司,实际使用时,达到30万/s。
查询测试
fbe6a4edc3eb :) select count(*) from metrics.samples;

SELECT count(*)
FROM metrics.samples

┌──count()─┐
│ 22687301 │
└──────────┘

1 rows in set. Elapsed: 0.014 sec. Processed 22.69 million rows, 45.37 MB (1.65 billion rows/s., 3.30 GB/s.)
其中最有可能耗时的查询:
1)查询聚合sum
fbe6a4edc3eb :) select sum(val) from metrics.samples where arrayExists(x -> 1 == match(x, 'cid=9'),tags) = 1 and name = 'machine_cpu_cores' and ts > '2017-07-11 08:00:00' SELECT sum(val)
FROM metrics.samples
WHERE (arrayExists(x -> (1 = match(x, 'cid=9')), tags) = 1) AND (name = 'machine_cpu_cores') AND (ts > '2017-07-11 08:00:00')

┌─sum(val)─┐
│ 6324 │
└──────────┘

1 rows in set. Elapsed: 0.022 sec. Processed 57.34 thousand rows, 34.02 MB (2.66 million rows/s., 1.58 GB/s.)
2)group by 查询
fbe6a4edc3eb :) select sum(val), time from metrics.samples where arrayExists(x -> 1 == match(x, 'cid=9'),tags) = 1 and name = 'machine_cpu_cores' and ts > '2017-07-11 08:00:00' group by toDate(ts) as time;

SELECT sum(val),
 time FROM metrics.samples
WHERE (arrayExists(x -> (1 = match(x, 'cid=9')), tags) = 1) AND (name = 'machine_cpu_cores') AND (ts > '2017-07-11 08:00:00')
GROUP BY toDate(ts) AS time

┌─sum(val)─┬───────time─┐
│ 6460 │ 2018-07-11 │
│ 136 │ 2018-07-12 │
└──────────┴────────────┘

2 rows in set. Elapsed: 0.023 sec. Processed 64.11 thousand rows, 36.21 MB (2.73 million rows/s., 1.54 GB/s.)
3) 正则表达式
fbe6a4edc3eb :) select sum(val) from metrics.samples where name = 'container_memory_rss' and arrayExists(x -> 1 == match(x, '^pod_name=ofo-eva-hub'),tags) = 1 ;

SELECT sum(val)
FROM metrics.samples
WHERE (name = 'container_memory_rss') AND (arrayExists(x -> (1 = match(x, '^pod_name=ofo-eva-hub')), tags) = 1)

┌─────sum(val)─┐
│ 870016516096 │
└──────────────┘

1 rows in set. Elapsed: 0.142 sec. Processed 442.37 thousand rows, 311.52 MB (3.11 million rows/s., 2.19 GB/s.)
总结:
利用好所建索引,即使在大数据量下,查询性能非常好。
方案设计
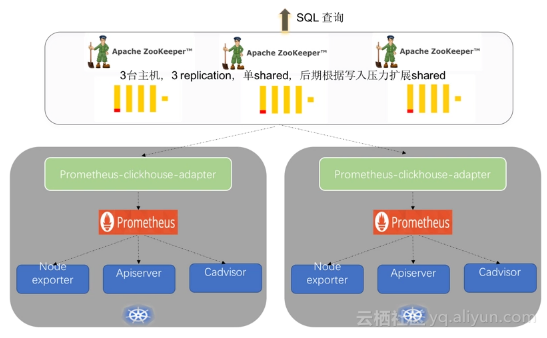
关于此架构,有以下几点:
- 每个k8s集群部署一个Prometheus-clickhouse-adapter 。关于Prometheus-clickhouse-adapter该组件,下面我们会详细解读。
- clickhouse 集群部署,需要zk集群做一致性表数据复制。
而clickhouse 的集群示意图如下:
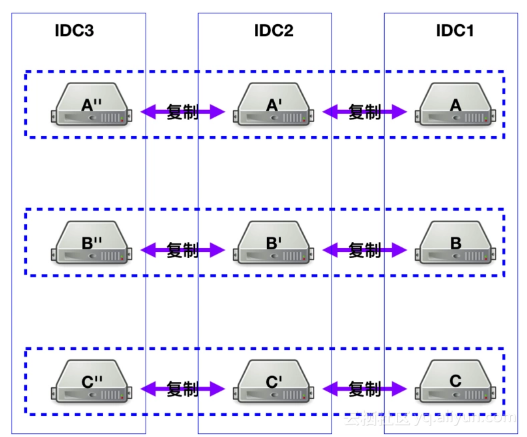
- ReplicatedMergeTree + Distributed。ReplicatedMergeTree里,共享同一个ZK路径的表,会相互,注意是,相互同步数据
- 每个IDC有3个分片,各自占1/3数据
- 每个节点,依赖ZK,各自有2个副本
这块详细步骤和思路,请参考ClickHouse集群搭建从0到1。感谢新浪的鹏哥指点。
zk集群部署注意事项:
- 安装 ZooKeeper 3.4.9或更高版本的稳定版本
- 不要使用zk的默认配置,默认配置就是一个定时炸弹。
The ZooKeeper server won't delete files from old snapshots and logs when usingthe default configuration (see autopurge), and this is the responsibility ofthe operator.ck官方给出的配置如下zoo.cfg:
# http://hadoop.apache.org/zookeeper/docs/current/zookeeperAdmin.html # The number of milliseconds of each tick
tickTime=2000
# The number of ticks that the initial # synchronization phase can take
initLimit=30000
# The number of ticks that can pass between # sending a request and getting an acknowledgement
syncLimit=10

maxClientCnxns=2000

maxSessionTimeout=60000000
# the directory where the snapshot is stored.
dataDir=/opt/zookeeper/{{ cluster['name'] }}/data
# Place the dataLogDir to a separate physical disc for better performance
dataLogDir=/opt/zookeeper/{{ cluster['name'] }}/logs

autopurge.snapRetainCount=10
autopurge.purgeInterval=1


# To avoid seeks ZooKeeper allocates space in the transaction log file in # blocks of preAllocSize kilobytes. The default block size is 64M. One reason # for changing the size of the blocks is to reduce the block size if snapshots # are taken more often. (Also, see snapCount).
preAllocSize=131072

# Clients can submit requests faster than ZooKeeper can process them, # especially if there are a lot of clients. To prevent ZooKeeper from running # out of memory due to queued requests, ZooKeeper will throttle clients so that # there is no more than globalOutstandingLimit outstanding requests in the # system. The default limit is 1,000.ZooKeeper logs transactions to a # transaction log. After snapCount transactions are written to a log file a # snapshot is started and a new transaction log file is started. The default # snapCount is 10,000.
snapCount=3000000

# If this option is defined, requests will be will logged to a trace file named # traceFile.year.month.day. #traceFile= # Leader accepts client connections. Default value is "yes". The leader machine # coordinates updates. For higher update throughput at thes slight expense of # read throughput the leader can be configured to not accept clients and focus # on coordination.
leaderServes=yes

standaloneEnabled=false
dynamicConfigFile=/etc/zookeeper-{{ cluster['name'] }}/conf/zoo.cfg.dynamic
每个版本的ck配置文件不太一样,这里贴出一个390版本的
<?xml version="1.0"?>
<yandex>
 <logger>
 <!-- Possible levels: https://github.com/pocoproject/poco/blob/develop/Foundation/include/Poco/Logger.h#L105 -->
 <level>information</level>
 <log>/data/ck/log/clickhouse-server.log</log>
 <errorlog>/data/ck/log/clickhouse-server.err.log</errorlog>
 <size>1000M</size>
 <count>10</count>
 <!-- <console>1</console> --> <!-- Default behavior is autodetection (log to console if not daemon mode and is tty) -->
 </logger>
 <!--display_name>production</display_name--> <!-- It is the name that will be shown in the client -->
 <http_port>8123</http_port>
 <tcp_port>9000</tcp_port>

 <!-- For HTTPS and SSL over native protocol. -->
 <!--
 <https_port>8443</https_port>
 <tcp_port_secure>9440</tcp_port_secure>
 -->

 <!-- Used with https_port and tcp_port_secure. Full ssl options list: https://github.com/ClickHouse-Extras/poco/blob/master/NetSSL_OpenSSL/include/Poco/Net/SSLManager.h#L71 -->
 <openSSL>
 <server> <!-- Used for https server AND secure tcp port -->
 <!-- openssl req -subj "/CN=localhost" -new -newkey rsa:2048 -days 365 -nodes -x509 -keyout /etc/clickhouse-server/server.key -out /etc/clickhouse-server/server.crt -->
 <certificateFile>/etc/clickhouse-server/server.crt</certificateFile>
 <privateKeyFile>/etc/clickhouse-server/server.key</privateKeyFile>
 <!-- openssl dhparam -out /etc/clickhouse-server/dhparam.pem 4096 -->
 <dhParamsFile>/etc/clickhouse-server/dhparam.pem</dhParamsFile>
 <verificationMode>none</verificationMode>
 <loadDefaultCAFile>true</loadDefaultCAFile>
 <cacheSessions>true</cacheSessions>
 <disableProtocols>sslv2,sslv3</disableProtocols>
 <preferServerCiphers>true</preferServerCiphers>
 </server>

 <client> <!-- Used for connecting to https dictionary source -->
 <loadDefaultCAFile>true</loadDefaultCAFile>
 <cacheSessions>true</cacheSessions>
 <disableProtocols>sslv2,sslv3</disableProtocols>
 <preferServerCiphers>true</preferServerCiphers>
 <!-- Use for self-signed: <verificationMode>none</verificationMode> -->
 <invalidCertificateHandler>
 <!-- Use for self-signed: <name>AcceptCertificateHandler</name> -->
 <name>RejectCertificateHandler</name>
 </invalidCertificateHandler>
 </client>
 </openSSL>

 <!-- Default root page on http[s] server. For example load UI from https://tabix.io/ when opening http://localhost:8123 -->
 <!--
 <http_server_default_response><![CDATA[<html ng-app="SMI2"><head><base href="http://ui.tabix.io/"></head><body><div ui-view="" class="content-ui"></div><script src="http://loader.tabix.io/master.js"></script></body></html>]]></http_server_default_response>
 -->

 <!-- Port for communication between replicas. Used for data exchange. -->
 <interserver_http_port>9009</interserver_http_port>

 <!-- Hostname that is used by other replicas to request this server.
 If not specified, than it is determined analoguous to 'hostname -f' command.
 This setting could be used to switch replication to another network interface.
 -->
 <!--
 <interserver_http_host>example.yandex.ru</interserver_http_host>
 -->

 <!-- Listen specified host. use :: (wildcard IPv6 address), if you want to accept connections both with IPv4 and IPv6 from everywhere. -->
 <!-- <listen_host>::</listen_host> -->
 <!-- Same for hosts with disabled ipv6: -->
 <listen_host>0.0.0.0</listen_host>

 <!-- Default values - try listen localhost on ipv4 and ipv6: -->
 <!--
 <listen_host>::1</listen_host>
 <listen_host>127.0.0.1</listen_host>
 -->
 <!-- Don't exit if ipv6 or ipv4 unavailable, but listen_host with this protocol specified -->
 <!-- <listen_try>0</listen_try> -->

 <!-- Allow listen on same address:port -->
 <!-- <listen_reuse_port>0</listen_reuse_port> -->

 <!-- <listen_backlog>64</listen_backlog> -->

 <max_connections>4096</max_connections>
 <keep_alive_timeout>3</keep_alive_timeout>

 <!-- Maximum number of concurrent queries. -->
 <max_concurrent_queries>100</max_concurrent_queries>

 <!-- Set limit on number of open files (default: maximum). This setting makes sense on Mac OS X because getrlimit() fails to retrieve
 correct maximum value. -->
 <!-- <max_open_files>262144</max_open_files> -->

 <!-- Size of cache of uncompressed blocks of data, used in tables of MergeTree family.
 In bytes. Cache is single for server. Memory is allocated only on demand.
 Cache is used when 'use_uncompressed_cache' user setting turned on (off by default).
 Uncompressed cache is advantageous only for very short queries and in rare cases.
 -->
 <uncompressed_cache_size>8589934592</uncompressed_cache_size>

 <!-- Approximate size of mark cache, used in tables of MergeTree family.
 In bytes. Cache is single for server. Memory is allocated only on demand.
 You should not lower this value.
 -->
 <mark_cache_size>5368709120</mark_cache_size>


 <!-- Path to data directory, with trailing slash. -->
 <path>/data/ck/data/</path>

 <!-- Path to temporary data for processing hard queries. -->
 <tmp_path>/data/ck/tmp/</tmp_path>

 <!-- Directory with user provided files that are accessible by 'file' table function. -->
 <user_files_path>/data/ck/user_files/</user_files_path>

 <!-- Path to configuration file with users, access rights, profiles of settings, quotas. -->
 <users_config>users.xml</users_config>

 <!-- Default profile of settings. -->
 <default_profile>default</default_profile>

 <!-- System profile of settings. This settings are used by internal processes (Buffer storage, Distibuted DDL worker and so on). -->
 <!-- <system_profile>default</system_profile> -->

 <!-- Default database. -->
 <default_database>default</default_database>

 <!-- Server time zone could be set here.

 Time zone is used when converting between String and DateTime types,
 when printing DateTime in text formats and parsing DateTime from text,
 it is used in date and time related functions, if specific time zone was not passed as an argument.

 Time zone is specified as identifier from IANA time zone database, like UTC or Africa/Abidjan.
 If not specified, system time zone at server startup is used.

 Please note, that server could display time zone alias instead of specified name.
 Example: W-SU is an alias for Europe/Moscow and Zulu is an alias for UTC.
 -->
 <!-- <timezone>Europe/Moscow</timezone> -->

 <!-- You can specify umask here (see "man umask"). Server will apply it on startup.
 Number is always parsed as octal. Default umask is 027 (other users cannot read logs, data files, etc; group can only read).
 -->
 <!-- <umask>022</umask> -->

 <!-- Configuration of clusters that could be used in Distributed tables.
 https://clickhouse.yandex/docs/en/table_engines/distributed/
 -->
 <remote_servers>
 <prometheus_ck_cluster>
 <!-- 数据分片1 -->
 <shard>
 <internal_replication>false</internal_replication>
 <replica>
 <host>ck11.ruly.xxx.net</host>
 <port>9000</port>
 </replica>
 <replica>
 <host>ck12.ruly.xxx.net</host>
 <port>9000</port>
 </replica>
 </shard>
 </prometheus_ck_cluster>
 </remote_servers>


 <!-- If element has 'incl' attribute, then for it's value will be used corresponding substitution from another file.
 By default, path to file with substitutions is /etc/metrika.xml. It could be changed in config in 'include_from' element.
 Values for substitutions are specified in /yandex/name_of_substitution elements in that file.
 -->

 <!-- ZooKeeper is used to store metadata about replicas, when using Replicated tables.
 Optional. If you don't use replicated tables, you could omit that.

 See https://clickhouse.yandex/docs/en/table_engines/replication/
 -->
 <!-- ZK -->
 <zookeeper>
 <node index="1">
 <host>zk1.ruly.xxx.net</host>
 <port>2181</port>
 </node>
 <node index="2">
 <host>zk2.ruly.xxx.net</host>
 <port>2181</port>
 </node>
 <node index="3">
 <host>zk3.ruly.xxx.net</host>
 <port>2181</port>
 </node>
 </zookeeper>

 <!-- Substitutions for parameters of replicated tables.
 Optional. If you don't use replicated tables, you could omit that.

 See https://clickhouse.yandex/docs/en/table_engines/replication/#creating-replicated-tables
 -->
 <macros>
 <shard>1</shard>
 <replica>ck11.ruly.ofo.net</replica>
 </macros>


 <!-- Reloading interval for embedded dictionaries, in seconds. Default: 3600. -->
 <builtin_dictionaries_reload_interval>3600</builtin_dictionaries_reload_interval>


 <!-- Maximum session timeout, in seconds. Default: 3600. -->
 <max_session_timeout>3600</max_session_timeout>

 <!-- Default session timeout, in seconds. Default: 60. -->
 <default_session_timeout>60</default_session_timeout>

 <!-- Sending data to Graphite for monitoring. Several sections can be defined. -->
 <!--
 interval - send every X second
 root_path - prefix for keys
 hostname_in_path - append hostname to root_path (default = true)
 metrics - send data from table system.metrics
 events - send data from table system.events
 asynchronous_metrics - send data from table system.asynchronous_metrics
 -->
 <!--
 <graphite>
 <host>localhost</host>
 <port>42000</port>
 <timeout>0.1</timeout>
 <interval>60</interval>
 <root_path>one_min</root_path>
 <hostname_in_path>true</hostname_in_path>

 <metrics>true</metrics>
 <events>true</events>
 <asynchronous_metrics>true</asynchronous_metrics>
 </graphite>
 <graphite>
 <host>localhost</host>
 <port>42000</port>
 <timeout>0.1</timeout>
 <interval>1</interval>
 <root_path>one_sec</root_path>

 <metrics>true</metrics>
 <events>true</events>
 <asynchronous_metrics>false</asynchronous_metrics>
 </graphite>
 -->


 <!-- Query log. Used only for queries with setting log_queries = 1. -->
 <query_log>
 <!-- What table to insert data. If table is not exist, it will be created.
 When query log structure is changed after system update,
 then old table will be renamed and new table will be created automatically.
 -->
 <database>system</database>
 <table>query_log</table>
 <!--
 PARTITION BY expr https://clickhouse.yandex/docs/en/table_engines/custom_partitioning_key/
 Example:
 event_date
 toMonday(event_date)
 toYYYYMM(event_date)
 toStartOfHour(event_time)
 -->
 <partition_by>toYYYYMM(event_date)</partition_by>
 <!-- Interval of flushing data. -->
 <flush_interval_milliseconds>7500</flush_interval_milliseconds>
 </query_log>


 <!-- Uncomment if use part_log
 <part_log>
 <database>system</database>
 <table>part_log</table>

 <flush_interval_milliseconds>7500</flush_interval_milliseconds>
 </part_log>
 -->


 <!-- Parameters for embedded dictionaries, used in Yandex.Metrica.
 See https://clickhouse.yandex/docs/en/dicts/internal_dicts/
 -->

 <!-- Path to file with region hierarchy. -->
 <!-- <path_to_regions_hierarchy_file>/opt/geo/regions_hierarchy.txt</path_to_regions_hierarchy_file> -->

 <!-- Path to directory with files containing names of regions -->
 <!-- <path_to_regions_names_files>/opt/geo/</path_to_regions_names_files> -->


 <!-- Configuration of external dictionaries. See:
 https://clickhouse.yandex/docs/en/dicts/external_dicts/
 -->
 <dictionaries_config>*_dictionary.xml</dictionaries_config>

 <!-- Uncomment if you want data to be compressed 30-100% better.
 Don't do that if you just started using ClickHouse.
 -->
 <!-- <compression incl="clickhouse_compression"> -->
 <!--
 <!- - Set of variants. Checked in order. Last matching case wins. If nothing matches, lz4 will be used. - ->
 <case>

 <!- - Conditions. All must be satisfied. Some conditions may be omitted. - ->
 <min_part_size>10000000000</min_part_size> <!- - Min part size in bytes. - ->
 <min_part_size_ratio>0.01</min_part_size_ratio> <!- - Min size of part relative to whole table size. - ->

 <!- - What compression method to use. - ->
 <method>zstd</method>
 </case>
 -->
 <!-- </compression> -->

 <!-- Allow to execute distributed DDL queries (CREATE, DROP, ALTER, RENAME) on cluster.
 Works only if ZooKeeper is enabled. Comment it if such functionality isn't required. -->
 <distributed_ddl>
 <!-- Path in ZooKeeper to queue with DDL queries -->
 <path>/clickhouse/task_queue/ddl</path>

 <!-- Settings from this profile will be used to execute DDL queries -->
 <!-- <profile>default</profile> -->
 </distributed_ddl>

 <!-- Settings to fine tune MergeTree tables. See documentation in source code, in MergeTreeSettings.h -->
 <!--
 <merge_tree>
 <max_suspicious_broken_parts>5</max_suspicious_broken_parts>
 </merge_tree>
 -->

 <!-- Protection from accidental DROP.
 If size of a MergeTree table is greater than max_table_size_to_drop (in bytes) than table could not be dropped with any DROP query.
 If you want do delete one table and don't want to restart clickhouse-server, you could create special file <clickhouse-path>/flags/force_drop_table and make DROP once.
 By default max_table_size_to_drop is 50GB, max_table_size_to_drop=0 allows to DROP any tables.
 Uncomment to disable protection.
 -->
 <!-- <max_table_size_to_drop>0</max_table_size_to_drop> -->

 <!-- Example of parameters for GraphiteMergeTree table engine -->
 <!-- <graphite_rollup>
 <pattern>
 <regexp>click_cost</regexp>
 <function>any</function>
 <retention>
 <age>0</age>
 <precision>3600</precision>
 </retention>
 <retention>
 <age>86400</age>
 <precision>60</precision>
 </retention>
 </pattern>
 <default>
 <function>max</function>
 <retention>
 <age>0</age>
 <precision>60</precision>
 </retention>
 <retention>
 <age>3600</age>
 <precision>300</precision>
 </retention>
 <retention>
 <age>86400</age>
 <precision>3600</precision>
 </retention>
 </default>
 </graphite_rollup> -->

 <!-- Directory in <clickhouse-path> containing schema files for various input formats.
 The directory will be created if it doesn't exist.
 -->
 <format_schema_path>/var/lib/clickhouse/format_schemas/</format_schema_path>

 <!-- Uncomment to disable ClickHouse internal DNS caching. -->
 <!-- <disable_internal_dns_cache>1</disable_internal_dns_cache> -->
 <!-- Max insert block size set to 4x than default size 1048576 -->

</yandex>
Prometheus-Clickhuse-Adapter组件
Prometheus-Clickhuse-Adapter(Prom2click) 是一个将clickhouse作为prometheus 数据远程存储的适配器。
prometheus-clickhuse-adapter,该项目缺乏日志,对于一个实际生产的项目,是不够的,此外一些数据库连接细节实现的也不够完善,已经在实际使用过程中将改进部分作为pr提交。
在实际使用过程中,要注意并发写入数据的数量,及时调整启动参数ch.batch 的大小,实际就是批量写入ck的数量,目前我们设置的是65536。因为ck的Merge引擎有一个300的限制,超过会报错
Too many parts (300). Merges are processing significantly slower than inserts300是指 processing,不是指一次批量插入的条数。
总结
这篇文章主要讲了我司Prometheus在存储方面的探索和实战的一点经验。后续会讲Prometheus查询和采集分离的高可用架构方案。
本文转自SegmentFault-Prometheus实战--存储篇