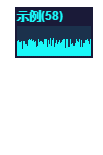
1.通过动态设置内部元素高度 =>示例<=
<!DOCTYPE html>
<html>
<head>
    <meta charset="UTF-8">
    <meta name="viewport" content="width=device-width, initial-scale=1.0">
    <meta http-equiv="X-UA-Compatible" content="ie=edge">
    <title>示例1</title>
    <style>
        #title {
            margin: 2px;
            font-family: Helvetica, Arial, sans-serif;
            font-size: 9px;
            font-weight: bold;
            line-height: 15px;
            color: rgb(0, 255, 255);
        }
        #demo {
            width: 74px;
            height: 30px;
            background: rgb(0, 255, 255);
            margin: 2px
        }
        span.col {
            width: 1px;
            height: 100%;
            float: left;
            opacity: 0.9;
            background: rgb(0, 0, 34);
        }
    </style>
</head>
<body>
    <div style=" opacity: 0.9; cursor: pointer; position: absolute; top: 0px;margin: 10px; background: rgb(0, 0, 34);">
        <div id="title"></div>
        <div id="demo"></div>
    </div>
    <script>
        function fillLineChart(id) {
            this.id = id;
            this.el = document.getElementById(id);
            this.value = 0;//当前值
            this.width = parseInt(this.el.clientWidth)
            this.last=this.width-1;//从左往右最后一个span的索引
            for (var i = 0; i < this.width; i++) {//初始化span
                this.el.innerHTML +='<span class="col"></span>';
            }
            this.draw = function (value) {//绘制事件
                this.value = value;//记录当前值
                for (var i = 0; i <this.last; i++) {//遍历前x-1个,将后一个值赋给前一个
                    var tmph = this.el.getElementsByTagName("span")[i + 1].style.height;//获取下一个值
                    this.el.getElementsByTagName("span")[i].style.height = tmph;//赋给当前的
                }
                this.el.getElementsByTagName("span")[this.last].style.height = parseInt(this.el.clientHeight) * (100 - this.value) / 100 + "px";//设置最后span一个高度=span容器的高度x值百分比
            }
        }
        var demo = new fillLineChart("demo");
        var val = 0
        setInterval(function () {
            val = rand(rand(20, 50), 60);
            document.getElementById('title').innerHTML = `示例(${val})`
            demo.draw(val);
        }, 100);
        function rand(begin, end) {
            return Math.floor(Math.random() * (end - begin)) + begin;
        }
    </script>
</body>
</html>
1.gif
2.通过Canvas =>示例<=
<!DOCTYPE html>
<html>
<head>
    <meta charset="UTF-8">
    <title>示例2</title>
    <style>
        #title {
            margin: 2px;
            font-family: Helvetica, Arial, sans-serif;
            font-size: 9px;
            font-weight: bold;
            line-height: 15px;
            color: rgb(0, 255, 255);
        }
        #demo {
            margin: 2px
        }
        span.col {
            width: 1px;
            height: 100%;
            float: left;
            opacity: 0.9;
            background: rgb(0, 0, 34);
        }
    </style>
</head>
<body>
    <div style=" opacity: 0.9; cursor: pointer; position: absolute; top: 0px;margin: 10px; background: rgb(0, 0, 34);">
        <div id="title"></div>
        <canvas id="demo" width="74" height="30"></canvas>
    </div>
    <script>
        function fillLineChart(id) {
            this.id = id;
            this.canvas = document.getElementById(id);
            this.value = 0;
            this.width = (this.canvas.clientWidth)//获取绑定宽度
            this.height = (this.canvas.clientHeight) //获取高度宽度
            this.context = this.canvas.getContext("2d");
            this.values = [];
            this.last = this.width - 1;//最后一个值的索引
            for (var i = 0; i < this.width; i++) {//初始化值
                this.values.push(this.height);
            }
            this.draw = function (value) {
                this.value = value;//记录当前值
                this.context.clearRect(0, 0, this.width, this.height);//清空
                this.context.beginPath();//开辟新的绘制路径
                this.context.moveTo(0, this.height);//绘制起点
                for (var i = 0; i <this.last; i++) {
                    this.values[i] = this.values[i + 1];//移动索引值
                    this.context.lineTo(i, this.values[i]);//结束位置
                }
                this.values[this.last] = this.height * (100 - value) / 100;//获取最后索引一个值
                this.context.lineTo(this.last, this.values[this.last]);//设置最后一个索引位置
                this.context.lineTo(i, this.height);//绘制结束
                this.context.fillStyle = ' rgb(0, 255, 255)';//填充绘制区域的颜色
                this.context.fill();//填充
            }
        }
        var demo = new fillLineChart("demo");
        var val = 0
        setInterval(function () {
            val = rand(rand(20, 50), 60);
            document.getElementById('title').innerHTML = `示例(${val})`
            demo.draw(val);
        }, 100);
        function rand(begin, end) {
            return Math.floor(Math.random() * (end - begin)) + begin;
        }
    </script>
</body>
</html>

2.gif
3.Canvas增强 =>示例<=
<!DOCTYPE html>
<html>
<head>
    <meta charset="UTF-8">
    <title>示例3</title>
    <style>
        #title {margin: 2px;
            font-family: Helvetica, Arial, sans-serif;
            font-size: 9px;
            font-weight: bold;
            line-height: 15px;
            color: rgb(0, 255, 255);}
        #demo {margin: 2px}
        span.col {
            width: 1px;
            height: 100%;
            float: left;
            opacity: 0.9;
            background: rgb(0, 0, 34);}
    </style>
</head>
<body>
    <label ><input type="checkbox" onclick="demo.isFull=this.checked" checked/>填充显示</label>
    <div style=" opacity: 0.9; cursor: pointer; position: absolute; top: 30px;margin: 10px; background: rgb(0, 0, 34);">
        <div id="title"></div>
        <canvas id="demo"></canvas>
    </div>
    <script>
        function lineChart(o) {
            this.id = o.id;
            this.canvas = document.getElementById(o.id);
            this.color = o.color || 'rgb(0, 255, 255)';
            this.value = 0;
            this.isFull = o.isFull || false;//是否填充颜色
            this.canvas.width = this.width = o.width || (this.canvas.clientWidth);//获取绑定宽度
            this.canvas.height = this.height = o.height || (this.canvas.clientHeight);//获取高度宽度
            this.context = this.canvas.getContext("2d");
            this.values = [];
            this.last = this.width - 1;//最后一个值的索引
            for (var i = 0; i < this.width; i++) {//初始化值
                this.values.push(this.height);
            }
            this.draw = function (value) {
                this.value = value;//记录当前值
                this.context.clearRect(0, 0, this.width, this.height);//清空
                this.context.beginPath();//开辟新的绘制路径
                this.context.moveTo(0, this.isFull ? this.height : this.values[1]);//绘制起点
                for (var i = 0; i < this.last; i++) {
                    this.values[i] = this.values[i + 1];//移动索引值
                    this.context.lineTo(i, this.values[i]);//结束位置
                }
                this.values[this.last] = this.height * (100 - value) / 100;//获取最后索引一个值
                this.context.lineTo(this.last, this.values[this.last]);//设置最后一个索引位置
                if (this.isFull) {
                    this.context.lineTo(i, this.height);//绘制结束
                    this.context.fillStyle = this.color;//填充绘制区域的颜色
                    this.context.fill();//填充
                } else {
                    this.context.strokeStyle = this.color;
                    this.context.stroke();
                }
            }
        }
        var demo = new lineChart({
            id: "demo",
            width: "74",
            height: "30",
            isFull: true,
        });
        var val = 0
        setInterval(function () {
            val = rand(rand(20, 50), 60);
            document.getElementById('title').innerHTML = `示例(${val})`
            demo.draw(val);
        }, 100);
        function rand(begin, end) {
            return Math.floor(Math.random() * (end - begin)) + begin;
        }
    </script>
</body>
</html>

3.gif