运行环境:
phpStorm 2018.1
php-7.2.4
php_xdebug-2.7.0alpha1-7.2-vc15-nts-x86_64.dll" 下载地址:https://xdebug.org/download.php
- PHP安装xdebug扩展
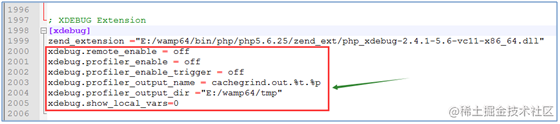
因为是自己搭建的php环境,所以需要在php.ini上添加一下配置:
[XDebug]
xdebug.profiler_output_dir="C:\phpstudy\tmp\xdebug"
xdebug.trace_output_dir="C:\phpstudy\tmp\xdebug"
zend_extension="C:\phpstudy\php\php-7.2.4-nts\ext\php_xdebug-2.7.0alpha1-7.2-vc15-nts-x86_64.dll"
xdebug.remote_enable = on
xdebug.remote_handler = dbgp
xdebug.remote_host= www.laravelsfc.com
xdebug.idekey = PHPSTORM
xdebug.auto_trace=on
xdebug.collect_params=on
xdebug.collect_return=on
xdebug.trace_output_dir="F:\AppServ\Xdebug"
xdebug.profiler_enable=on
xdebug.profiler_output_dir="F:\AppServ\Xdebug"
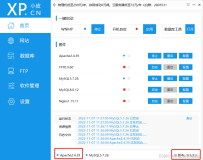
- 保存php.ini,重新启动apache检查是否成功开启了xdebug服务.
image.png
-
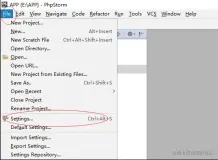
打开phpStorm,快捷键Clt+Alt+S打开settings搜索Xdebug.
image.png如果在上级菜单栏->PHP中phpStorm没有自动识别php版本,则自己手动添加
image.png
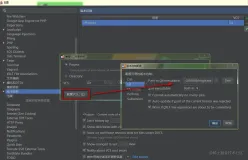
4.进入Settings>PHP>Debug>DBGp Proxy,IDE key 填 PHPSTORM,host 填localhost,port填9000
image.png5.进入Settings>PHP>Servers,这里要填写服务器端的相关信息,如:name填localhost,host填localhost,port填80,debugger选XDebug
image.png
6.进入Run> Debug configurations,点+号选择PHP Web Application,Server选填localhost,Start URL填你要访问的页面(如:/index.php), Browser 默认或者选chrome
image.png
其实5和6的步骤可以一气呵成
在导航栏中(没有显示则设置View->Navigation Bar)选择Edit Configurations...
image.png
7.打开浏览器,如果是用chrome或者Firefox可以找到对应的XDebug工具,工具的设置里的IDE KEY填上phpStorm,把localhost加入到白名单,以后调试的时候把工具启用就好了。如果是用其他浏览器,可以访问http://www.jetbrains.com/phpstorm/marklets/,在右边填上phpStorm,点generate,把下面的链接添加到收藏夹,方便调用。
我用的是这款
image.png
8.好了,这下都配置好了,开始断点测试吧。在phpStorm里打开Debug监听,就是电话按钮那个,然后在代码前断点,点击绿色的debug爬虫按钮,chrome浏览器打开xdebug页,phpStorm出现debug窗口
image.png
出现如图,证明你配置成功了
image.png
其它
安装wincachegrind
由于效能监测文件:cachegrind.out.×××文件的内容不易被理解,可以用工具wincachegrind来读取它。
1)、下载安装wincachegrind
2)、安装运行后,点击Tools->options,设定你的working folder(php.ini里xdebug.profiler_output_dir的值)
这样就可以比较直观的查看效能监测文件的信息了。
image.png