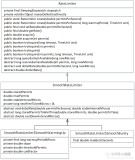
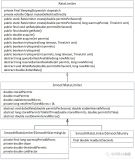
先来张类图

从上图可以看出StressTestUtils是和开发者打交道的最主要的类;
下面来个例子
package com.taobao.stresstester;
import com.taobao.stresstester.core.StressTask;
import java.io.PrintStream;
public class Example
{
public static void main(String[] args)
{
StressTestUtils.testAndPrint(100, 1000, new StressTask()
{
public Object doTask()
throws Exception
{
System.out.println(“Do my task.”);
return null;
}
});
}
}
下面我来介绍主要原理吧:
1.开启多线程去跑目标代码(每个线程访问的次数=总请求次数/并发数)
public StressResult test(int concurrencyLevel, int totalRequests, StressTask stressTask, int warmUpTime)
{
if (stressTask == null) {
stressTask = this.emptyTestService;
}
warmUp(warmUpTime, stressTask);
int everyThreadCount = totalRequests / concurrencyLevel;
CyclicBarrier threadStartBarrier = new CyclicBarrier(concurrencyLevel);
CountDownLatch threadEndLatch = new CountDownLatch(concurrencyLevel);
AtomicInteger failedCounter = new AtomicInteger();
StressContext stressContext = new StressContext();
stressContext.setTestService(stressTask);
stressContext.setEveryThreadCount(everyThreadCount);
stressContext.setThreadStartBarrier(threadStartBarrier);
stressContext.setThreadEndLatch(threadEndLatch);
stressContext.setFailedCounter(failedCounter);
ExecutorService executorService = Executors.newFixedThreadPool(concurrencyLevel);
List<StressThreadWorker> workers = new ArrayList(concurrencyLevel);
for (int i = 0; i < concurrencyLevel; i++)
{
StressThreadWorker worker = new StressThreadWorker(stressContext, everyThreadCount);
workers.add(worker);
}
for (int i = 0; i < concurrencyLevel; i++)
{
StressThreadWorker worker = (StressThreadWorker)workers.get(i);
executorService.submit(worker);
}
try
{
threadEndLatch.await();
}
catch (InterruptedException e)
{
log.error(“InterruptedException”, e);
}
executorService.shutdownNow();
int realTotalRequests = everyThreadCount * concurrencyLevel;
int failedRequests = failedCounter.get();
StressResult stressResult = new StressResult();
SortResult sortResult = getSortedTimes(workers);
List<Long> allTimes = sortResult.allTimes;
stressResult.setAllTimes(allTimes);
List<Long> trheadTimes = sortResult.trheadTimes;
long totalTime = ((Long)trheadTimes.get(trheadTimes.size() – 1)).longValue();
stressResult.setTestsTakenTime(totalTime);
stressResult.setFailedRequests(failedRequests);
stressResult.setTotalRequests(realTotalRequests);
stressResult.setConcurrencyLevel(concurrencyLevel);
stressResult.setWorkers(workers);
return stressResult;
}
为什么要用2个同步辅助类CyclicBarrier,CountDownLatch
//设置线程集合点,等所有现存启动完毕在一起请求任务
CyclicBarrier threadStartBarrier = new CyclicBarrier(concurrencyLevel);
//控制所有线程做完任务后状态,数量为0的时间,所有任务执行完毕
CountDownLatch threadEndLatch = new CountDownLatch(concurrencyLevel);
2.记录每次调用代码的时间,放到一个集合中
SortResult sortResult = getSortedTimes(workers);
List<Long> allTimes = sortResult.allTimes;
3.计算打印出tps /平均耗时/最短耗时/最长耗时
TPS=并发数/平均的相应时间
平均响应时间=测试总时间/总请求次数
package com.taobao.stresstester.core;
import java.io.IOException;
import java.io.Writer;
import java.util.List;
import org.slf4j.Logger;
import org.slf4j.LoggerFactory;
public class SimpleResultFormater
implements StressResultFormater
{
protected static Logger log = LoggerFactory.getLogger(SimpleResultFormater.class);
public void format(StressResult stressResult, Writer writer)
{
long testsTakenTime = stressResult.getTestsTakenTime();
int totalRequests = stressResult.getTotalRequests();
int concurrencyLevel = stressResult.getConcurrencyLevel();
float takes = StatisticsUtils.toMs(testsTakenTime);
List<Long> allTimes = stressResult.getAllTimes();
long totaleTimes = StatisticsUtils.getTotal(allTimes);
float tps = 1.0E+009F * (concurrencyLevel * (totalRequests / (float)totaleTimes));
float averageTime = StatisticsUtils.getAverage(totaleTimes,
totalRequests);
float onTheadAverageTime = averageTime / concurrencyLevel;
int count_50 = totalRequests / 2;
int count_66 = totalRequests * 66 / 100;
int count_75 = totalRequests * 75 / 100;
int count_80 = totalRequests * 80 / 100;
int count_90 = totalRequests * 90 / 100;
int count_95 = totalRequests * 95 / 100;
int count_98 = totalRequests * 98 / 100;
int count_99 = totalRequests * 99 / 100;
long longestRequest = ((Long)allTimes.get(allTimes.size() – 1)).longValue();
long shortestRequest = ((Long)allTimes.get(0)).longValue();
StringBuilder view = new StringBuilder();
view.append(” Concurrency Level:\t”).append(concurrencyLevel)
.append(“–并发数”);
view.append(“\r\n Time taken for tests:\t”).append(takes).append(” ms”)
.append(“–测试耗时”);
view.append(“\r\n Complete Requests:\t”).append(totalRequests)
.append(“–完成测试次数”);
view.append(“\r\n Failed Requests:\t”)
.append(stressResult.getFailedRequests()).append(“–失败次数”);
view.append(“\r\n Requests per second:\t”).append(tps).append(“–QPS”);
view.append(“\r\n Time per request:\t”)
.append(StatisticsUtils.toMs(averageTime)).append(” ms”)
.append(“–平均耗时”);
view.append(“\r\n Time per request:\t”)
.append(StatisticsUtils.toMs(onTheadAverageTime))
.append(” ms (across all concurrent requests)”)
.append(“–平均耗时,忽略并发影响”);
view.append(“\r\n Shortest request:\t”)
.append(StatisticsUtils.toMs(shortestRequest)).append(” ms”)
.append(“–最短耗时”);
StringBuilder certainTimeView = view;
certainTimeView
.append(“\r\n Percentage of the requests served within a certain time (ms)”);
certainTimeView.append(“\r\n 50%\t”)
.append(StatisticsUtils.toMs(((Long)allTimes.get(count_50)).longValue()))
.append(“–50% 的耗时在0.005703毫秒以下”);
certainTimeView.append(“\r\n 66%\t”).append(
StatisticsUtils.toMs(((Long)allTimes.get(count_66)).longValue()));
certainTimeView.append(“\r\n 75%\t”).append(
StatisticsUtils.toMs(((Long)allTimes.get(count_75)).longValue()));
certainTimeView.append(“\r\n 80%\t”).append(
StatisticsUtils.toMs(((Long)allTimes.get(count_80)).longValue()));
certainTimeView.append(“\r\n 90%\t”).append(
StatisticsUtils.toMs(((Long)allTimes.get(count_90)).longValue()));
certainTimeView.append(“\r\n 95%\t”).append(
StatisticsUtils.toMs(((Long)allTimes.get(count_95)).longValue()));
certainTimeView.append(“\r\n 98%\t”).append(
StatisticsUtils.toMs(((Long)allTimes.get(count_98)).longValue()));
certainTimeView.append(“\r\n 99%\t”).append(
StatisticsUtils.toMs(((Long)allTimes.get(count_99)).longValue()));
certainTimeView.append(“\r\n 100%\t”)
.append(StatisticsUtils.toMs(longestRequest))
.append(” (longest request)”).append(“–最长的耗时”);
try
{
writer.write(view.toString());
}
catch (IOException e)
{
log.error(“IOException:”, e);
}
}
}
总结一下:
这个工具的原理主要通过多线程模拟用户的请求行为,设置栅栏,等待所有线程一起发起请求,完成指定次数。记录每次请求的时间和本次测试的总时间,然后根据公式计算出TPS /平均响应时间,顺便可以打印最小和最大响应时间。今天讲解到此结束,希望对大家有所启示。
原文发布时间为:2018-07-11
本文作者: HARRIES
本文来自云栖社区合作伙伴“Java杂记”,了解相关信息可以关注“Java杂记”