[20180212]hanganalyze简单探究.txt
--//在我看来使用hanganalyze探究阻塞以及死锁问题,简直是耍酷,我从来不用这种方式探究与解决问题,里面的信息羞涩难以理解.
--//简单的做一个enq: TX - row lock contention例子,算是了解与学习.
--//测试参考:http://www.oracleblog.org/working-case/deal-with-row-cache-lock/
1.环境:
@ &r/ver1
ALTER SESSION SET EVENTS 'immediate trace name HANGANALYZE level <level>'; ----(回话级别的hanganalyze)
oradebug setospid
oradebug analyze <level> ----实例级别的hanganalyze
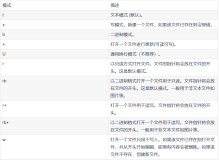
Dump Level Dump Contains
------------------------------------------------------------------------------------------
1-2 Only HANGANALYZE output, no process dump at all
3 Level 2 + Dump only processes thought to be in a hang (IN_HANG state)
4 Level 3 + Dump leaf nodes (blockers) in wait chains (LEAF,LEAF_NW,IGN_DMP state)
5 Level 4 + Dump all processes involved in wait chains (NLEAF state)
10 Dump all processes (IGN state)
--//level=3,4 足以.最多5.
2.建立测试例子:
create table t (id ) as select rownum from xmltable('1 to 2');
SCOTT@book> select * from t;
ID
----------
1
2
SCOTT@book> create unique index pk_t on t(id);
Index created.
3.测试展开:
--//session1,插入不提交:
SCOTT@book(274,5)> @ &r/spid
SID SERIAL# PROCESS SERVER SPID PID P_SERIAL# C50
---------- ---------- ------------------------ --------- ------ ------- ---------- --------------------------------------------------
274 5 41457 DEDICATED 41458 21 3 alter system kill session '274,5' immediate;
SCOTT@book(274,5)> insert into t values (3);
1 row created.
--//session2,插入不提交:
SCOTT@book(94,7)> @ &r/spid
SID SERIAL# PROCESS SERVER SPID PID P_SERIAL# C50
---------- ---------- ------------------------ --------- ------ ------- ---------- --------------------------------------------------
94 7 41523 DEDICATED 41524 31 3 alter system kill session '94,7' immediate;
SCOTT@book(94,7)> insert into t values (3);
--挂起!
4.使用hanganalyze分析:
SYS@book> oradebug setmypid
Statement processed.
SYS@book> oradebug hanganalyze 3;
Hang Analysis in /u01/app/oracle/diag/rdbms/book/book/trace/book_ora_41532.trc
--//转载:http://www.oracleblog.org/working-case/deal-with-row-cache-lock/
--//我们来看看([nodenum]/cnode/sid/sess_srno/session/ospid/state/start/finish/[adjlist]/predecessor)部分:
nodenum是hanganalyze自己为了记录这些会话而定制的编号,从0开始排起。
cnode是Node Id
sid是 Session ID
sess_srno是serial#
proc_ptr是Process Pointer
ospid 是OS Process ID
state 是node的状态
adjlist是临近的node(通常代表一个blocker node)
predecessor是Predecessor node ,通常代表一个 waiter node
state部分有几个比较重要的状态:
1.IN_HANG:这表示该node处于死锁状态,通常还有其他node(blocker)也处于该状态
2.LEAF/LEAF_NW:该node通常是blocker。通过条目的"predecessor"列可以判断这个node是否是blocker。LEAF说明该NODE没有等待其他
资源,而LEAF_NW则可能是没有等待其他资源或者是在使用CPU.
3.NLEAF:通常可以看作这些会话是被阻塞的资源。发生这种情况一般说明数据库发生性能问题而不是数据库hang
4.IGN/IGN_DMP:这类会话通常被认为是空闲会话,除非其adjlist列里存在node。如果是非空闲会话则说明其adjlist里的node正在等待其他node释放资源。
5.SINGLE_NODE/SINGLE_NODE_NW:近似于空闲会话
*** 2018-02-13 10:03:43.709
===============================================================================
HANG ANALYSIS:
instances (db_name.oracle_sid): book.book
oradebug_node_dump_level: 3
analysis initiated by oradebug
os thread scheduling delay history: (sampling every 1.000000 secs)
0.000000 secs at [ 10:03:43 ]
NOTE: scheduling delay has not been sampled for 0.020745 secs 0.000000 secs from [ 10:03:39 - 10:03:44 ], 5 sec avg
0.000000 secs from [ 10:02:44 - 10:03:44 ], 1 min avg
0.000000 secs from [ 09:58:44 - 10:03:44 ], 5 min avg
vktm time drift history
===============================================================================
Chains most likely to have caused the hang:
[a] Chain 1 Signature: 'SQL*Net message from client'<='enq: TX - row lock contention'
Chain 1 Signature Hash: 0x38c48850
[b] Chain 2 Signature: 'LNS ASYNC end of log'
Chain 2 Signature Hash: 0x8ceed34f
===============================================================================
Non-intersecting chains:
-------------------------------------------------------------------------------
Chain 1:
-------------------------------------------------------------------------------
Oracle session identified by:
{
instance: 1 (book.book)
os id: 41524
process id: 31, oracle@gxqyydg4 (TNS V1-V3)
session id: 94
session serial #: 7
}
is waiting for 'enq: TX - row lock contention' with wait info:
{
p1: 'name|mode'=0x54580004
p2: 'usn<<16 | slot'=0xa001c
p3: 'sequence'=0x5803
time in wait: 18.788400 sec
timeout after: never
wait id: 38
blocking: 0 sessions
current sql: insert into t values (3)
short stack: ksedsts()+465<-ksdxfstk()+32<-ksdxcb()+1927<-sspuser()+112<-__sighandler()<-semtimedop()+10<-skgpwwait()+160<-ksliwat()+2022<-kslwaitctx()+163<-ksqcmi()+2848<-ksqgtlctx()+3501<-ksqgelctx()+557<-ktuGetTxForXid()+131<-ktcwit1()+336<-ktbgtl0()+1142<-kdiins0()+44906<-kdiinsp()+91<-kauxsin()+1784<-qesltcLoadIndexList()+922<-qesltcLoadIndexes()+55<-qerltcSimpleSingleInsRowCBK()+70<-qerltcSingleRowLoad()+279<-qerltcFetch()+380<-insexe()+682<-opiexe()+5632<-kpoal8()+2118<-opiodr()+917<-ttcpip()+2183<-opitsk()+1710<-opiino
wait history:
* time between current wait and wait #1: 0.000501 sec
1. event: 'SQL*Net message from client'
time waited: 10.453921 sec
wait id: 37 p1: 'driver id'=0x62657100
p2: '#bytes'=0x1
* time between wait #1 and #2: 0.000027 sec
2. event: 'SQL*Net message to client'
time waited: 0.000001 sec
wait id: 36 p1: 'driver id'=0x62657100
p2: '#bytes'=0x1
* time between wait #2 and #3: 0.000017 sec
3. event: 'SQL*Net message from client'
time waited: 0.000231 sec
wait id: 35 p1: 'driver id'=0x62657100
p2: '#bytes'=0x1
}
and is blocked by
=> Oracle session identified by:
{
instance: 1 (book.book)
os id: 41458
process id: 21, oracle@gxqyydg4 (TNS V1-V3)
session id: 274
session serial #: 5
}
which is waiting for 'SQL*Net message from client' with wait info:
{
p1: 'driver id'=0x62657100
p2: '#bytes'=0x1
time in wait: 1 min 7 sec
timeout after: never
wait id: 183
blocking: 1 session
current sql: <none>
short stack: ksedsts()+465<-ksdxfstk()+32<-ksdxcb()+1927<-sspuser()+112<-__sighandler()<-read()+14<-ntpfprd()+117<-nsbasic_brc()+376<-nsbrecv()+69<-nioqrc()+495<-opikndf2()+978<-opitsk()+831<-opiino()+969<-opiodr()+917<-opidrv()+570<-sou2o()+103<-opimai_real()+133<-ssthrdmain()+265<-main()+201<-__libc_start_main()+244
wait history:
* time between current wait and wait #1: 0.000009 sec
1. event: 'SQL*Net message to client'
time waited: 0.000001 sec
wait id: 182 p1: 'driver id'=0x62657100
p2: '#bytes'=0x1
* time between wait #1 and #2: 0.000263 sec
2. event: 'db file sequential read'
time waited: 0.000007 sec
wait id: 181 p1: 'file#'=0x4
p2: 'block#'=0x22f
p3: 'blocks'=0x1
* time between wait #2 and #3: 0.000014 sec
3. event: 'db file sequential read'
time waited: 0.000007 sec
wait id: 180 p1: 'file#'=0x4
p2: 'block#'=0x22e
p3: 'blocks'=0x1
}
Chain 1 Signature: 'SQL*Net message from client'<='enq: TX - row lock contention'
Chain 1 Signature Hash: 0x38c48850
...
===============================================================================
Extra information that will be dumped at higher levels:
[level 4] : 1 node dumps -- [LEAF] [LEAF_NW]
[level 5] : 2 node dumps -- [NO_WAIT] [INVOL_WT] [SINGLE_NODE] [NLEAF] [SINGLE_NODE_NW]
State of ALL nodes
([nodenum]/cnode/sid/sess_srno/session/ospid/state/[adjlist]):
[40]/1/41/7/0x85b1ddf0/41421/SINGLE_NODE/
[93]/1/94/7/0x85bb9a90/41524/NLEAF/[273]
[273]/1/274/5/0x8561fd00/41458/LEAF/
*** 2018-02-13 10:03:43.711
===============================================================================
END OF HANG ANALYSIS
===============================================================================
*** 2018-02-13 10:03:43.712
===============================================================================
HANG ANALYSIS DUMPS:
oradebug_node_dump_level: 3
===============================================================================
State of LOCAL nodes
([nodenum]/cnode/sid/sess_srno/session/ospid/state/[adjlist]):
[40]/1/41/7/0x85b1ddf0/41421/SINGLE_NODE/
[93]/1/94/7/0x85bb9a90/41524/NLEAF/[273]
~~~~~~~~~~~~~~~~~~~~~~~~~~~~~~~~~~~~~~~~~~
[273]/1/274/5/0x8561fd00/41458/LEAF/
~~~~~~~~~~~~~~~~~~~~~~~~~~~~~~~~~~~~~
No processes qualify for dumping.
===============================================================================
HANG ANALYSIS DUMPS: END
===============================================================================
*** 2018-02-13 10:03:43.712
Oradebug command 'hanganalyze 3' console output:
Hang Analysis in /u01/app/oracle/diag/rdbms/book/book/trace/book_ora_41532.trc
--//注意看下划线:
([nodenum]/cnode/sid/sess_srno/session/ospid/state/[adjlist]):
[93]/1/94/7/0x85bb9a90/41524/NLEAF/[273]
[273]/1/274/5/0x8561fd00/41458/LEAF/
--//sid=94,指向273行.
--//sid=274是阻塞者.
--//实际上前面的Chain 1已经很容易理解.