前言
在上一篇文章中我们梳理了Influxdb的代码主流程结构,从本篇开始将会对Influxdb中的各种Service进行分析,由于篇幅的限制,在这篇文章中会先介绍下MonitorService。在上文中,我们知道Influxdb是通过如下的方式注册Service。
    //cmd/influxd/run/server.go 371
    s.appendMonitorService()
    s.appendPrecreatorService(s.config.Precreator)
    s.appendSnapshotterService()
    s.appendContinuousQueryService(s.config.ContinuousQuery)
    s.appendHTTPDService(s.config.HTTPD)
    s.appendStorageService(s.config.Storage)
    s.appendRetentionPolicyService(s.config.Retention)
并通过如下的代码进行依次的调用的
    //cmd/influxd/run/server.go 434
    for _, service := range s.Services {
        if err := service.Open(); err != nil {
            return fmt.Errorf("open service: %s", err)
        }
    }
那么我们就可以从此处入手,剥离每个Service。
MonitorService解析
我们先来看下MonitorService的核心代码,可以发现MonitorService的初始化更多是在确保MonitorService是运行态的单例,并且注册了一些诊断的实例,最后判断配置是否支持存储,如果支持存储,会开启goroutine定期异步将数据存储在TSM Engine中。
//influxdb/monitor/service.go 73行
// New returns a new instance of the monitor system.
func New(r Reporter, c Config) *Monitor {
    return &Monitor{
        globalTags:           make(map[string]string),
        diagRegistrations:    make(map[string]diagnostics.Client),
        reporter:             r,
        storeEnabled:         c.StoreEnabled,
        storeDatabase:        c.StoreDatabase,
        storeInterval:        time.Duration(c.StoreInterval),
        storeRetentionPolicy: MonitorRetentionPolicy,
        Logger:               zap.NewNop(),
    }
}

// open returns whether the monitor service is open.
func (m *Monitor) open() bool {
    m.mu.Lock()
    defer m.mu.Unlock()
    return m.done != nil
}

// Open opens the monitoring system, using the given clusterID, node ID, and hostname
// for identification purpose.
func (m *Monitor) Open() error {
    if m.open() {
        m.Logger.Info("Monitor is already open")
        return nil
    }

    m.Logger.Info("Starting monitor service")

    // Self-register various stats and diagnostics.
    m.RegisterDiagnosticsClient("build", &build{
        Version: m.Version,
        Commit:  m.Commit,
        Branch:  m.Branch,
        Time:    m.BuildTime,
    })
    m.RegisterDiagnosticsClient("runtime", &goRuntime{})
    m.RegisterDiagnosticsClient("network", &network{})
    m.RegisterDiagnosticsClient("system", &system{})

    m.mu.Lock()
    m.done = make(chan struct{})
    m.mu.Unlock()

    // If enabled, record stats in a InfluxDB system.
    if m.storeEnabled {
        hostname, _ := os.Hostname()
        m.SetGlobalTag("hostname", hostname)

        // Start periodic writes to system.
        m.wg.Add(1)
        go m.storeStatistics()
    }

    return nil
}
下面重点看下storeStatistics中做的事情,storeStatistics中主要是通过Statistics方法获取stats,然后再通过writePoints方法写入到相应的store中。
//influxdb/monitor/service.go 418行
func (m *Monitor) storeStatistics() {
    defer m.wg.Done()
    m.Logger.Info("Storing statistics", logger.Database(m.storeDatabase), logger.RetentionPolicy(m.storeRetentionPolicy), logger.DurationLiteral("interval", m.storeInterval))

    // Wait until an even interval to start recording monitor statistics.
    // If we are interrupted before the interval for some reason, exit early.
    if err := m.waitUntilInterval(m.storeInterval); err != nil {
        return
    }

    tick := time.NewTicker(m.storeInterval)
    defer tick.Stop()

    for {
        select {
        case now := <-tick.C:
            now = now.Truncate(m.storeInterval)
            func() {
                m.mu.Lock()
                defer m.mu.Unlock()
                m.createInternalStorage()
            }()

            stats, err := m.Statistics(m.globalTags)
            if err != nil {
                m.Logger.Info("Failed to retrieve registered statistics", zap.Error(err))
                return
            }

            // Write all stats in batches
            batch := make(models.Points, 0, 5000)
            for _, s := range stats {
                pt, err := models.NewPoint(s.Name, models.NewTags(s.Tags), s.Values, now)
                if err != nil {
                    m.Logger.Info("Dropping point", zap.String("name", s.Name), zap.Error(err))
                    return
                }
                batch = append(batch, pt)
                if len(batch) == cap(batch) {
                    m.writePoints(batch)
                    batch = batch[:0]

                }
            }

            // Write the last batch
            if len(batch) > 0 {
                m.writePoints(batch)
            }
        case <-m.done:
            m.Logger.Info("Terminating storage of statistics")
            return
        }
    }
}
比较有趣的是Statistics方法不仅返回了[]*Statistic类型的监控指标,还通过expvar将数据通过API进行暴露,Go 标准库有一个 expvar 包。 这个包可以通过 JSON 格式的 HTTP API 公开您的应用程序和 Go 运行时的指标,有点类似prometheus的API 抓取的数据格式。而MonitorService的数据来源是通过runtime包获取。重要包含内存、goroutines等相关系统指标。
//influxdb/monitor/service.go 324行
statistic.Values = map[string]interface{}{
"Alloc": int64(rt.Alloc),
"TotalAlloc": int64(rt.TotalAlloc),
"Sys": int64(rt.Sys),
"Lookups": int64(rt.Lookups),
"Mallocs": int64(rt.Mallocs),
"Frees": int64(rt.Frees),
"HeapAlloc": int64(rt.HeapAlloc),
"HeapSys": int64(rt.HeapSys),
"HeapIdle": int64(rt.HeapIdle),
"HeapInUse": int64(rt.HeapInuse),
"HeapReleased": int64(rt.HeapReleased),
"HeapObjects": int64(rt.HeapObjects),
"PauseTotalNs": int64(rt.PauseTotalNs),
"NumGC": int64(rt.NumGC),
"NumGoroutine": int64(runtime.NumGoroutine()),
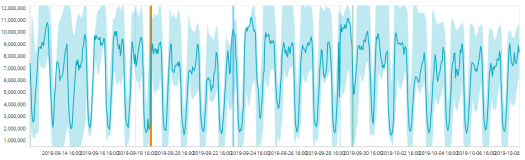
}我们可以看下在TSM Engine中的存储的内容
细心的同学可能已经发现,在_internal库中还包含了很多其他的监控数据,那么这些数据是哪里来的呢,其实在上文中,我们忽略了一个重要的对象Reportor,在实例化Monitor的时候传递一个实现了Reporter接口实例r,Reporter接口定义了一个Statistics的方法,我们可以发现QueryExecutor,TSDBStore,PointsWriter,Subscriber等核心组件都实现了Statistics方法。
// cmd/influxd/run/server.go 210行
// Statistics returns statistics for the services running in the Server.
func (s *Server) Statistics(tags map[string]string) []models.Statistic {
    var statistics []models.Statistic
    statistics = append(statistics, s.QueryExecutor.Statistics(tags)...)
    statistics = append(statistics, s.TSDBStore.Statistics(tags)...)
    statistics = append(statistics, s.PointsWriter.Statistics(tags)...)
    statistics = append(statistics, s.Subscriber.Statistics(tags)...)
    for _, srv := range s.Services {
        if m, ok := srv.(monitor.Reporter); ok {
            statistics = append(statistics, m.Statistics(tags)...)
        }
    }
    return statistics
}
在gatherStatistics方法中会调用reporter,并将相应的数据与runtime等diagnoseClient的数据进行合并,并写入到Influxdb中。
//influxdb/monitor/service.go 347行
func (m *Monitor) gatherStatistics(statistics []*Statistic, tags map[string]string) []*Statistic {
   m.mu.RLock()
   defer m.mu.RUnlock()

   if m.reporter != nil {
      for _, s := range m.reporter.Statistics(tags) {
         statistics = append(statistics, &Statistic{Statistic: s})
      }
   }
   return statistics
}
总结
到此Influxdb的监控服务部分就比较清晰了,首先监控分为系统级别的监控和组件级别的监控,系统级别的监控会通过runtime的方式获取,组件级别的监控会通过各自组件实现Reportor接口进行实现,Influxdb会定期的存储监控数据到TSM Engine的_internal库中。同样Influxdb也会通过expvar将监控数据暴露到API上。