Valgrind简介
Valgrind是一个开源工具集合,其中最有名的是Memcheck可用来检测C,C++程序的内存泄露,判断程序运行是否会crash或者产生不可预知的结果。
Valgrind Memcheck工具的用法
以下内容参考自Valgrind的quick start manual
http://www.valgrind.org/docs/manual/quick-start.html
- 首先需要准备程序,注意程序编译时必须打开DEBUG,gcc -g参数。同时建议使用-O0编译,以免编译器优化代码后Valgrind无法给出实际的代码位置。
- 如果你的程序是这样运行的
myprog arg1 arg2使用 valgrind 这样运行
Valgrind --leak-check=yes myprog arg1 arg2
The --leak-check option turns on the detailed memory leak detector- 例子
需要跟踪的程序代码
这部分代码将有两处错误可以被检测到
  #include <stdlib.h>

  void f(void)
  {
     int* x = malloc(10 * sizeof(int));
     x[10] = 0;        // problem 1: heap block overrun
  }                        // problem 2: memory leak -- x not freed

  int main(void)
  {
     f();
     return 0;
  }
跟踪到的结果及解释
第一个错误 heap block overrun
  ==19182== Invalid write of size 4  # 错误类型,一次越界写产生的invalid write
  ==19182==    at 0x804838F: f (example.c:6)   # 下面是进程的stack trace
  ==19182==    by 0x80483AB: main (example.c:11)
  ==19182==  Address 0x1BA45050 is 0 bytes after a block of size 40 alloc'd    # 描述产生错误的内存地址
  ==19182==    at 0x1B8FF5CD: malloc (vg_replace_malloc.c:130)
  ==19182==    by 0x8048385: f (example.c:5)
  ==19182==    by 0x80483AB: main (example.c:11)
19182表示PID
第二个错误,内存泄露
  ==19182== 40 bytes in 1 blocks are definitely lost in loss record 1 of 1  # 错误类型,产生内存泄露
  ==19182==    at 0x1B8FF5CD: malloc (vg_replace_malloc.c:130)  # 请忽略该系统调用
  ==19182==    by 0x8048385: f (a.c:5)  # 这里是产生错误的根源
  ==19182==    by 0x80483AB: main (a.c:11)
产生内存泄露的类型非常多,最常见的两种
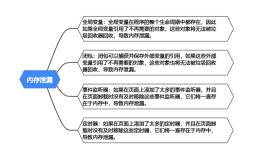
"definitely lost": your program is leaking memory -- fix it!  必须fix的
"probably lost": your program is leaking memory, unless you're doing funny things with pointers (such as moving them to point to the middle of a heap block).   需要关注的,做一些操作时才会触发。
如果报了一些未初始化值(uninitialised values)的错误,则需要给valgrind加--track-origins=yes参数,输出更详细的信息来分析。
如何检测PostgreSQL内存泄露
首先需要安装valgrind以及开发包
yum install -y valgrind valgrind-develPostgreSQL 9.4开始,内核层面支持valgrind。
编译前需要改一下头文件。
src/include/pg_config_manual.h 把#define USE_VALGRIND的注释去掉
/*
 * Include Valgrind "client requests", mostly in the memory allocator, so
 * Valgrind understands PostgreSQL memory contexts.  This permits detecting
 * memory errors that Valgrind would not detect on a vanilla build.  See also
 * src/tools/valgrind.supp.  "make installcheck" runs 20-30x longer under
 * Valgrind.  Note that USE_VALGRIND slowed older versions of Valgrind by an
 * additional order of magnitude; Valgrind 3.8.1 does not have this problem.
 * The client requests fall in hot code paths, so USE_VALGRIND also slows
 * native execution by a few percentage points.
 *
 * You should normally use MEMORY_CONTEXT_CHECKING with USE_VALGRIND;
 * instrumentation of repalloc() is inferior without it.
 */
#define USE_VALGRIND

/*
 * Define this to check memory allocation errors (scribbling on more
 * bytes than were allocated).  Right now, this gets defined
 * automatically if --enable-cassert or USE_VALGRIND.
 */
#if defined(USE_ASSERT_CHECKING) || defined(USE_VALGRIND)
#define MEMORY_CONTEXT_CHECKING
#endif
编译参数
CFLAGS=-O0 ./configure --prefix=/home/digoal/pgsql9.5 --enable-debug
gmake world -j 32
gmake install-world -j 32
确认编译正确
$ pg_config得到如下结果
CFLAGS = -Wall -Wmissing-prototypes -Wpointer-arith -Wdeclaration-after-statement -Wendif-labels -Wmissing-format-attribute -Wformat-security -fno-strict-aliasing -fwrapv -fexcess-precision=standard -g -O0启用Valgrind调试PostgreSQL
初始化数据库集群,配置数据库配置文件等,略。
使用 Valgrind启动数据库(需要指定PostgreSQL源码中的src/tools/valgrind.supp,这个文件是按照Valgrind提供的格式写的,有兴趣可以研究一下它的内容)
$ cd postgresql-9.5.3_src/

$ valgrind --leak-check=yes --gen-suppressions=all \
    --suppressions=src/tools/valgrind.supp --time-stamp=yes \
    --log-file=/tmp/%p.log --trace-children=yes \
    --track-origins=yes --read-var-info=yes \
    --show-leak-kinds=all -v \
    postgres --log_line_prefix="%m %p " \
    --log_statement=all --shared_buffers=4GB 2>&1 | tee /tmp/postmaster.log

启动会非常慢,等待它启动完成。
Valgrind的参数略
Valgrind --help
regresstest模式
另外开启一个会话
cd postgresql-9.5.3_src
make installcheck
观察 --log-file=/tmp/%p.log 日志
用户定制调试
另外开启一个会话
查询backend pid
select * from pg_backend_pid();输入需要测试的SQL
观察pid对应的 --log-file=/tmp/%p.log 日志