啃别人的骨头
https://www.xiaomastack.com/2014/07/03/zabbixdbtable/
http://www.furion.info/623.html?utm_source=tuicool&utm_medium=referral
1.zabbix表关系
2.hosts
hostid,host(包括模板)
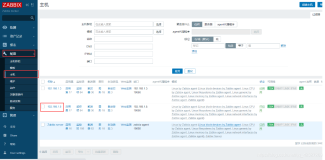
hostid:每台主机唯一id标识;host:主机名;status:主机状态标识(为0则是你要找的主机,3表示的貌似是模板主机)
3.groups
groupid,name
4.hosts_groups
hosts,groups
5.items
hostid,itemid
items表则记录着没台主机所有图形项目(比如一个网卡图,有流入和流出两根线,则这张图就有两个item)。字段说明,itemid是每个绘图项目唯一标识,hostid每个主机的标识,name每个item的名字,delay数据采集间隔,history历史数据保存时间,status标识item的状态(0表示正常显示的item),units保存item的单位
6.graphs_items
gitemid,graphid,itemid
关联着每幅图的item和图形id,简单的说就是告诉我们每台主机有多少幅图及每幅图上有哪些item
7.graphs
graphid
8.history,history_text,history_uint
itemid
9.trends,trends_uint
itemid
分割线
-------------------------------------------------
10.actions
actionid,
actions表记录了当触发器触发时,需要采用的动作
11.alerts
alerts 表保存了历史的告警事件,可以从这个表里面去做一些统计分析,例如某个部门、 某人、某类时间的告警统计,以及更深入的故障发生、恢复时间,看你想怎么用了。
alertid,actionid,eventid,userid
12.functions
itemid,triggerid
function 表时非常重要的一个表了,记录了trigger中使用的表达式,例如max、last、nodata等函数。
13.trigger_discovery
triggerid,parent_triggerid
案例
zabbix如何批量更新错误图表 2014/06
http://www.furion.info/654.html
graphs_sql = " select graphid , name from graphs where name like '%端口队列发包量' "
#获取graphid
items_sql = " select i.hostid ,g.gitemid,i.itemid ,i.description from items as i left join graphs_items g on i.itemid = g.itemid where g.graphid= %s" % graphid
#获取hostid,itemid
new_itemid_sql = "select hostid ,itemid,description from items where hostid=%d and description='%s'" %(hostid, description_new)
#获取正确的itemid
sql_update = "update graphs_items set itemid=%d where graphid = %d and gitemid=%d " %(itemid_new,graphid, gitemid)
#利用更新错的数据,更新正确的itemid
四个sql语句搞定
2.zabbix批量更新主机关联的模板
http://www.furion.info/703.html
get_host_template
sql = 'select ht.templateid from hosts_templates ht, hosts h where h.hostid = ht.hostid and h.hostid=%s' %(hostid)
或者template.get
涉及两个表 hosts_templates和hosts
3.19vs30,其实items都会有,这样的查询是错误的。
select t1.* from hosts_templates t1 where t1.hostid in(
select ii.hostid from items ii where ii.`name` like '%GC%'
and ii.hostid IN (select htt.hostid from hosts_templates htt where htt.templateid='10143') GROUP BY ii.hostid
) GROUP BY t1.hostid
比如你想查找出那些有应用模板但是没有items的主机,那些是有故障的
-
找出hostid
select htt.hostid from hosts_templates htt where htt.templateid='10143' and htt.hostid not in (
select ii.hostid from items ii where ii.`name` like '%tomcat%'
and ii.hostid IN (select htt.hostid from hosts_templates htt where htt.templateid='10143') GROUP BY ii.hostid
) group by htt.hostid
2.然后与hosts表连接
select * from hosts kk where kk.hostid in (
select htt.hostid from hosts_templates htt where htt.templateid='10143' and htt.hostid not in (
select ii.hostid from items ii where ii.`name` like '%tomcat%'
and ii.hostid IN (select htt.hostid from hosts_templates htt where htt.templateid='10143') GROUP BY ii.hostid
) group by htt.hostid
)
4.查询不支持的项目select status,itemid,hostid,name,key_ from items where status=1;
总之,zabbix表关系设计的很好。多余的字段也会显示是否故障,比如类似status字段。
问题
1.自动发现规则的表是哪张
2.到主机,可以定位哪些主机的值更新存在异常(比unreachable的报警更加准确)
更新
|
1
2
3
4
5
6
7
8
9
10
11
12
13
14
15
16
17
18
19
20
21
22
23
24
25
26
27
28
29
30
31
32
33
34
35
36
37
38
39
40
41
42
43
44
45
46
47
48
49
50
51
52
53
54
55
56
57
58
59
60
61
62
63
64
65
66
67
68
69
70
71
72
73
74
75
76
77
78
79
80
81
82
83
84
85
86
87
88
89
90
91
92
93
94
95
96
97
98
99
100
101
102
103
104
105
106
107
108
109
110
111
112
113
114
115
116
117
118
119
120
121
122
123
124
125
126
127
128
129
130
131
132
133
134
135
136
137
138
139
140
141
142
143
144
145
146
147
148
149
150
151
152
153
154
155
156
157
158
159
160
161
162
163
164
165
166
167
168
169
170
171
172
173
174
175
176
177
178
179
180
181
182
183
184
185
186
187
188
189
190
191
192
193
194
195
196
197
198
199
200
201
202
203
204
205
206
207
|
zabbix 表结构
hosts
-
>hostid
-
>templateid
hosts表
hostid host
1v1
关系
hosts_templates
hostid templateid 多v1关系
alerts表是记录已经发送邮件的记录
所以界面上是从哪个表取出来的。
events
SELECT
*
FROM information_schema.`KEY_COLUMN_USAGE`
WHERE referenced_table_name
=
'events'
因为zabbix有很多外键,所以说这个设计很不错。尤其要注意子表与主表的关联,比如events
所以分析zabbix表结构,首先从外键看起,谁的外键多,谁就是主表,那么就是源头了。
events acknowledged
select
*
from
events where eventid
=
'4516146'
;
eventid source
object
objectid clock value acknowledged ns
4516146
0
0
13791
1470815425
1
1
125453205
5
3
0
13477
1465962284
1
0
97450859
hosts.hostid
-
>hosts_groups.hostid
hosts_groups.groupid
-
>groups.groupid
hosts.hostid
-
>items.hostid
items.itemid
-
>functions.itemid
functions.triggerid
-
>triggers.triggerid
triggers.triggerid
-
>events.objectid
functionid itemid triggerid function parameter
10199
10019
10016
diff
0
{functionid}>
100
意味着itemid(
10019
)的values>
100
意思就是items的值关联function方式,然后triggers是否为
1
还是
0
(正常)
sql语法
1
:
select ht.templateid
from
hosts_templates ht, hosts h where h.hostid
=
ht.hostid
-
-
and
h.hostid
=
'10084'
;
解析 hosts的hostid去匹配hosts_templates,所以记录总数为hosts_templates,有重复.
sql语法
2
: 找出那些有应用模板但是没有items的主机,那些是有故障的
select
*
from
hosts where hostid
in
(
SELECT
htt.hostid
FROM
hosts_templates htt
WHERE
htt.templateid
=
'10143'
AND htt.hostid NOT IN (
SELECT
ii.hostid
FROM
items ii
WHERE
ii.`name` LIKE
'%tomcat%'
AND ii.hostid IN (
SELECT
htt.hostid
FROM
hosts_templates htt
WHERE
htt.templateid
=
'10143'
)
GROUP BY
ii.hostid
)
GROUP BY
htt.hostid
)
sql语法
3
:查看items中停用的项目
SELECT
b. HOST,
a.itemid,
a.hostid,
a. NAME,
a.key_
FROM
items a,
HOSTS b
WHERE
b.hostid
=
a.hostid
AND a. STATUS
=
1
sql语法
4
:
create table tmp1 as
(SELECT
`hosts`.`host`,
`triggers`.triggerid,
`triggers`.description,
`triggers`.priority,
`events`.`value`,
FROM_UNIXTIME(`events`.clock) time
FROM
`hosts`,
`triggers`,
`events`,
`items`,
`functions`,
`groups`,
`hosts_groups`
WHERE
`hosts`.hostid
=
`hosts_groups`.hostid
AND `hosts_groups`.groupid
=
`groups`.groupid
AND `triggers`.triggerid
=
`events`.objectid
AND `hosts`.hostid
=
`items`.hostid
AND `items`.itemid
=
`functions`.itemid
AND `functions`.triggerid
=
`triggers`.triggerid);
-
-
告警数据 alter表
select FROM_UNIXTIME(clock),sendto,`subject`
from
alerts
-
-
where `subject` like
'%磁盘%'
and
where DATE_FORMAT(FROM_UNIXTIME(clock),
'%Y-%m-%d'
)
=
DATE_FORMAT(NOW(),
'%Y-%m-%d'
);
select FROM_UNIXTIME(clock),hh.
*
from
alerts hh where status !
=
1
and
TO_DAYS(NOW())
-
TO_DAYS(FROM_UNIXTIME(clock)) <
365
;
select FROM_UNIXTIME(clock),hh.
*
from
alerts hh where status !
=
1
and
DATE_FORMAT(NOW(),
'%Y-%m-%d'
)
-
DATE_FORMAT(FROM_UNIXTIME(clock),
'%Y-%m-%d'
) <
30
;
events
select FROM_UNIXTIME(h.clock),h.subject,FROM_UNIXTIME(f.clock),f.
*
from
events f,
(select clock,`subject`,eventid
from
alerts
where DATE_FORMAT(FROM_UNIXTIME(clock),
'%Y-%m-%d'
)
=
DATE_FORMAT(NOW(),
'%Y-%m-%d'
)
) as h
where f.eventid
=
h.eventid
(
32723
select
*
from
functions where itemid
=
'32723'
15497
select
*
from
`triggers` where triggerid
=
'15497'
;
select
*
from
`events`
select
1504618584
select from_unixtime(
1504618584
,
'%Y%m%d %H:%i:%S'
)) 得到的时间为
20170905
21
:
36
:
24
select from_unixtime(tt.clock,
'%Y%m%d %H:%i:%S'
),tt.
*
from
events tt
where eventid
in
(
select
*
from
alerts order by from_unixtime(clock,
'%Y%m%d %H:%i:%S'
) desc)
order by eventid desc limit
1
,
5000
hosts
hostid 是ip和模板
select i.itemid,h.host
from
items i,hosts h where i.hostid
=
h.hostid
and
h.host
=
'xxxx'
and
i.name
in
(
'regionserver writeRequestsCount'
,
'regionserver requests'
);
详细步骤
select
*
from
hosts where host
=
'192.1.1.206'
; hostid
select
*
from
items where hostid
=
'10084'
;
select
*
from
items where hostid
=
'10084'
and
name like
'%war%'
; itemid
总体
hosts,items 联合查询itemid,然后通过itemid到history_unit查询更新记录
报警trigger条件,记录到triggers表中,然后符合条件的过滤到alerts,就会发送出去
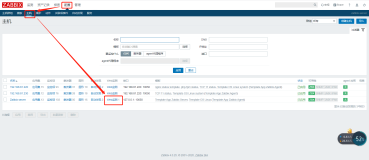
主屏幕最近
20
个问题,表示的是获取到的值一直没有改变。去striggers查询
如果一直没发邮件出去,那么就会挂在web界面上,然后即使你action了,也不会去从数据库执行那套操作。就会一直挂着,除非你改变状态。
问题
1.
为什么在主屏幕上显示,而不是发送邮件。
triggers表,alters表没有数据
CREATE TABLE `triggers` (
`triggerid` bigint(
20
) unsigned NOT NULL,
`expression` varchar(
2048
) NOT NULL DEFAULT '',
`description` varchar(
255
) NOT NULL DEFAULT '',
`url` varchar(
255
) NOT NULL DEFAULT '',
`status`
int
(
11
) NOT NULL DEFAULT
'0'
,
`value`
int
(
11
) NOT NULL DEFAULT
'0'
,
`priority`
int
(
11
) NOT NULL DEFAULT
'0'
,
`lastchange`
int
(
11
) NOT NULL DEFAULT
'0'
,
`comments` text NOT NULL,
`error` varchar(
128
) NOT NULL DEFAULT '',
`templateid` bigint(
20
) unsigned DEFAULT NULL,
`
type
`
int
(
11
) NOT NULL DEFAULT
'0'
,
`state`
int
(
11
) NOT NULL DEFAULT
'0'
,
`flags`
int
(
11
) NOT NULL DEFAULT
'0'
,
PRIMARY KEY (`triggerid`),
KEY `triggers_1` (`status`),
KEY `triggers_2` (`value`,`lastchange`),
KEY `triggers_3` (`templateid`),
CONSTRAINT `c_triggers_1` FOREIGN KEY (`templateid`) REFERENCES `triggers` (`triggerid`) ON DELETE CASCADE
) ENGINE
=
InnoDB DEFAULT CHARSET
=
utf8;
|
本文转自 liqius 51CTO博客,原文链接:http://blog.51cto.com/szgb17/1888611,如需转载请自行联系原作者