Not Your Average Average1 Dr. Neil J. Gunther
Performance Dynamics Company SM
Castro Valley, California, USA
www.perfdynamics.com
Originally presented Sep 4, 2002
Updated by NJG Feb 21, 2003
| In order to view the mathematical notations correctly, check here before continuing. |
What's This Talk About?
Averages are important for performance analysis and capacity planning. There are many manifestations of averages e.g., arithmetic average (the usual one), moving average (used in financial forecasting), geometric average (used in the SPEC benchmarks), harmonic average (not used enough), and so on.
Other averages are taken over time i.e., time-dependent averages. A particular example of such a time-dependent average is the load average metric that appears in certain UNIX (and therefore Linux) commands. Have you ever wondered how those three little numbers are produced?
In this presentation, I shall start at the surface (the shell) and gradually submerge into the depths of the Linux kernel to find out how the Linux load average gets calculated.
Finally, I'll compare the load average with other averaging techniques used in performance analysis and capacity planning.
What is the Load Average?
Appears in the ASCII output of certain UNIX commands ...
[pax:~]% uptime
    9:40am  up 9 days, 10:36,  4 users,  load average: 0.02, 0.01, 0.00
And on Linux systems ...
[pax:~]% procinfo
    Linux 2.0.36 (root@pax) (gcc 2.7.2.3) #1 Wed Jul 25 21:40:16 EST 2001 [pax]

    Memory:      Total        Used        Free      Shared     Buffers      Cached
    Mem:         95564       90252        5312       31412       33104       26412
    Swap:        68508           0       68508

    Bootup: Sun Jul 21 15:21:15 2002    Load average: 0.15 0.03 0.01 2/58 8557
    ...
Three numbers: 1-, 5-, and 15-, minute averages of .... ?
How the Guru's Define LOAD ...
Man Pages (oops!)
        [pax:~]% man "load average"
        No manual entry for load average
Tim O'Reilly and Crew, p.726
The load average tries to measure the number of active processes at any time. As a measure of CPU utilization, the load average is simplistic, poorly defined, but far from useless.
Adrian Cockcroft, p.229
The load average is the sum of the run queue length and the number of jobs currently running on the CPUs. In Solaris 2.0 and 2.2 the load average did not include the running jobs but this bug was fixed in Solaris 2.3.
Graphical Display of Load Average
Can be displayed as a time series
What is an ``Average'' Load?
Tim O'Reilly and Crew
What's high? ... Ideally, you'd like a load average under, say, 3, ... Ultimately, 'high' means high enough so that you don't need uptime to tell you that the system is overloaded.
... different systems will behave differently under the same load average. ... running a single cpu-bound background job .... can bring response to a crawl even though the load avg remains quite low.
Blair Zajac (ORCA Author)
If long term trends indicate increasing figures, more or faster CPUs will eventually be necessary unless load can be displaced. For ideal utilization of your CPU, the maximum value here should be equal to the number of CPUs in the box.
Some hedging because the load average is not your average kind of average. It's a time-dependent average ... a damped time-dependent average.
But you're a Linux expert and you knew this already. Right?
Let's find out ...

``The LA Triplets'' Quiz
| Random Samples A. load average: 6.85, 7.37, 7.83
B. load average: 8.50, 10.93, 8.61
C. load average: 37.34, 9.47, 3.30
is the load:
Sequential Samples 8:00am load average: 1.21 0.81 0.13
8:10am load average: 37.34 9.47 3.30
8:50am load average: 19.21 16.02 7.40
9:15am load average: 13.92 15.13 8.18
9:40am load average: 10.51 13.50 8.47
10:30am load average: 8.50 10.93 8.61
11:00am load average: 8.15 9.84 8.55
11:20am load average: 7.72 9.20 8.44
1:00pm load average: 6.85 7.37 7.83
Imagine a sysadm running the uptime command at those wall-clock times. In which LA sample does maximum load occur?
Excluding the first LA sample at 8am, in which sample does least load occur?:
Visual Hints
The 3 dots correspond to the 3 numeric LA values. The y-axis shows the load values and the x-axis shows a range of time between 1 and 15 minutes. The left-most point represents the 1-minute load average, the middle point represents the 5-minute load average and the right-most the 15-minute load average. Here is an animation of the above sequence.
|

Simple Experiment
Two hot-loops initiated in background on single-CPU Linux box. Two phases in the test over the course of 1 hour:
- CPU pegged for 2100 seconds then processes killed.
- CPU quiescent for the remaining 1500 seconds.
Perl script sampled load average every 5 minutes using uptime
Experimental Results 2
- 1-minute LA reaches a value of 2.0 after 300 seconds into the test
- 5-minute LA reaches 2.0 around 1200 seconds
- 15-minute LA would reach 2.0 at 4500 seconds (but processes killed at 2100 seconds)
(Resembles the charging/discharging of an RC circuit)
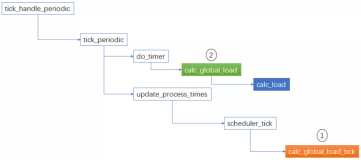
Into the Depths ...
http://lxr.linux.no/source/kernel/...

        unsigned long avenrun[3];
        624
        625 static inline void calc_load(unsigned long ticks)
        626 {
        627         unsigned long active_tasks; /* fixed-point */
        628         static int count = LOAD_FREQ;
        629
        630         count -= ticks;
        631         if (count
The sampling interval of LOAD_FREQ is once every 5 HZ. How often is that?
LA Sampling Interval
Recall that:
        1 HZ    =   100 ticks
        5 HZ    =   500 ticks
Therefore:
        1 tick  =    10 milliseconds
      500 ticks =  5000 milliseconds (or 5 seconds)
So 5 HZ means that CALC_LOAD is called every 5 seconds.
Don't confuse this period with the reporting periods {1-, 5-, 15-} minutes.
LA Calculations
CALC_LOAD is a C macro defined in this code fragment:
        58 extern unsigned long avenrun[ ];        /* Load averages */
        59
        60 #define FSHIFT          11              /* nr of bits of precision */
        61 #define FIXED_1         (1>= FSHIFT;
There are two points of interest here:
- What does CALC_LOAD actually do?
- What are the magic numbers: 1884, 2014, 2037?
Fixed Point Factors
Use 1-minute sampling as example. Conversion of exp(5/60) into base-2 with 11 bits of precision can be calculated as:
|
Calculate magic numbers directly from the formula:
|
Magic Numbers
Magic numbers for 5-second sampling rate.
|
        63 #define EXP_1           1884            /* 1/exp(5sec/1min)  */
        64 #define EXP_5           2014            /* 1/exp(5sec/5min)  */
        65 #define EXP_15          2037            /* 1/exp(5sec/15min) */
If the sampling rate was decreased to 2 second intervals...
|
What does CALC_LOAD do?
Consider the 1-minute CALC_LOAD function:
        67 #define CALC_LOAD(load,exp,n) \
        68         load *= exp; \
        69         load += n*(FIXED_1-exp); \
It's the fixed-point arithmetic version of:
|
(1) |
Special Case: n(t) = 0
Subsituting into eqn.( 1) ...
|
(2) |
Eqn.( 2) represents exponential decay of the type we saw in the experiments after 2100 seconds.
Special Case: n(t) = 2
Here, the second term dominates in eqn.( 2):
|
(3) |
Eqn.( 3) is monotonically increasing. Decay constant t RC_1 = 1 minute. Rise Time ? 5 t RC_1 = 5 minutes (300 seconds).
Exponential Smoothing/Filtering
A general purpose way for prepping highly variable data.
Available in tools like EXCEL, R/S +, Mathematica.
General form of smoothed data is:
|
(4) |
|
(5) |
Relation to Other Averages
So, EXP_R plays the role of a damping factor in the UNIX LA.
Moving Average (MA) ? Arithmetic average with lag-k (see shortly).
Load Average(LA) ? Exponentially-damped MA (Exp-MA)
|
where a = 1 - exp(-5/60R).
Steady-State Averages
Look at load over a long time (t ? ?) and break the time series into set of columns.
- Dt ? column width
- Q(Dt) x Dt ? sub-area
- 弯font >Q(Dt) x Dt ? total area
The time-averaged queue length: [(弯font >Q(Dt) x Dt)/ T] ? Q
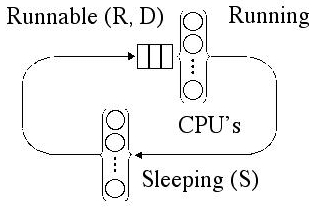
Model of Run-Queue
Steady-state averages:
- N: running processes
- Z: sleeping processes
- X: thoughput
- D: CPU service time (in Ticks)
- R: total execution time
|
This is the kind of model I used in my previous LUV talk (July 11,2000) in which I analyzed the average performance metrics associated with a fair-share scheduler.
The same kind of averages are used in my performance analyzer tool called Pretty Damn Quick.
Hyper-growth Website Planning
The problem:
- What is the growth rate?
- Forecast back-end capacity requirements
Published in: Performance Engineering: State of the Art and Current Trends, Springer Lecture Notes in Computer Science, 2001.
Download a copy from www.perfdynamics.com/papers.html
The General Approach
- Sample time series data
- Apply MA (or Exp-MA) to remove variance effects
- Forecast using nonlinear regression
- Scalability projections (See Refs. 1 & 2)
Sample Time Series
Total CPU utlilization on back-end server (E10K).
Data was collected using SE Toolkit/Percolator. Similar to OCRAlator.
Apply Moving Averages
Projected Growth Rate
Doubling time ? 6 months!
Week 20 was Y2K.
Quiz Solutions
| Here are the solutions to the quiz given earlier. Time Series This is the original time series during the 300 minutes in which the samples were collected.
Load Averages A plot of the load averages over 300 minutes.
An Easier Way? Just reverse the time axis. As described in the Visual Hints section of the quiz, the 3 dots correspond to the 3 numeric LA values and the y-axis shows the load values. But here, the x-axis shows a range of time between -15 and 0 minutes. The left-most point now represents the 15-minute load average, the middle point represents the 5-minute load average and the right-most the 1-minute load average. This representation more closely represents the trend in time.
|
Further Reading
- N. J. Gunther, The Practical Performance Analyst, Print-On-Demand, iUniverse.com, Inc., Lincoln, Nebraska, 2000
- N. J. Gunther, Performance and Scalability Models for a Hypergrowth e-Commerce Web Site, Performance Engineering: State of the Art and Current Trends, R. Dumke and C. Rautenstrauch and A. Schmietendorf and A. Scholz, # 2047, 267-282, Springer-Verlag, Heidelberg, 2001
- J. Peek and T. O'Reilly and M. Loukides, UNIX Power Tools, 2nd edn., O'Reilly & Assoc. Inc., Sebastopol, California, 1997
- D. P. Bovet and M. Cesati, Understanding the Linux Kernel, O'Reilly & Assoc. Inc., Sebastopol, California, 2001
- A. Cockcroft and R. Pettit, Sun Performance and Tuning, 2nd., SunSoft Press, Mountain View, California, 1998
Want to Know More?
Guerrilla Capacity Planning

May, August 2003
Guerrilla Capacity Tools 
November 2003
Then ... Go forth and Kong-ka! 
Footnotes:
1 Copyright © 2002 - 2003 Performance Dynamics Company. All Rights Reserved.
2 Thanks to Mirko Fluher for letting me use pax.apana.org.au
File translated from TEX by TTH , version 2.25.
On 21 Feb 2003, 11:51.