一、Kibana安装
Kibana 是为 Elasticsearch 设计的开源分析和可视化平台。你可以使用 Kibana 来搜索,查看存储在 Elasticsearch 索引中的数据并与之交互。你可以很容易实现高级的数据分析和可视化,以图表的形式展现出来。
kiabana下载地址:https://artifacts.elastic.co/downloads/kibana/kibana-6.0.0-x86_64.rpm
[root@linux-node1 ~]# wget https://artifacts.elastic.co/downloads/kibana/kibana-6.0.0-x86_64.rpm
[root@linux-node1 ~]# yum install -y kibana-6.0.0-x86_64.rpm
[root@linux-node1 ~]# vim /etc/kibana/kibana.yml
[root@linux-node1 ~]# grep "^[a-Z]" /etc/kibana/kibana.yml
server.port: 5601        #监听端口
server.host: "192.168.56.11"      #监听IP地址,建议内网ip
elasticsearch.url: "http://192.168.56.11:9200"       #elasticsearch连接kibana的URL,也可以填写192.168.56.12,因为它们是一个集群
[root@linux-node1 ~]# systemctl enable kibana
Created symlink from /etc/systemd/system/multi-user.target.wants/kibana.service to /etc/systemd/system/kibana.service.
[root@linux-node1 ~]# systemctl start kibana
监听端口为:5601
[root@linux-node1 ~]# ss -tnl
State       Recv-Q Send-Q                                                 Local Address:Port                                                                Peer Address:Port
LISTEN      0      128                                                                *:9100                                                                           *:*
LISTEN      0      128                                                                *:22                                                                             *:*
LISTEN      0      100                                                        127.0.0.1:25                                                                             *:*
LISTEN      0      128                                                    192.168.56.11:5601                                                                           *:*
LISTEN      0      128                                             ::ffff:192.168.56.11:9200                                                                          :::*
LISTEN      0      128                                             ::ffff:192.168.56.11:9300                                                                          :::*
LISTEN      0      128                                                               :::22                                                                            :::*
LISTEN      0      100                                                              ::1:25                                                                            :::*
LISTEN      0      80                                                                :::3306                                                                          :::*
浏览器访问192.168.56.11:5601,如图: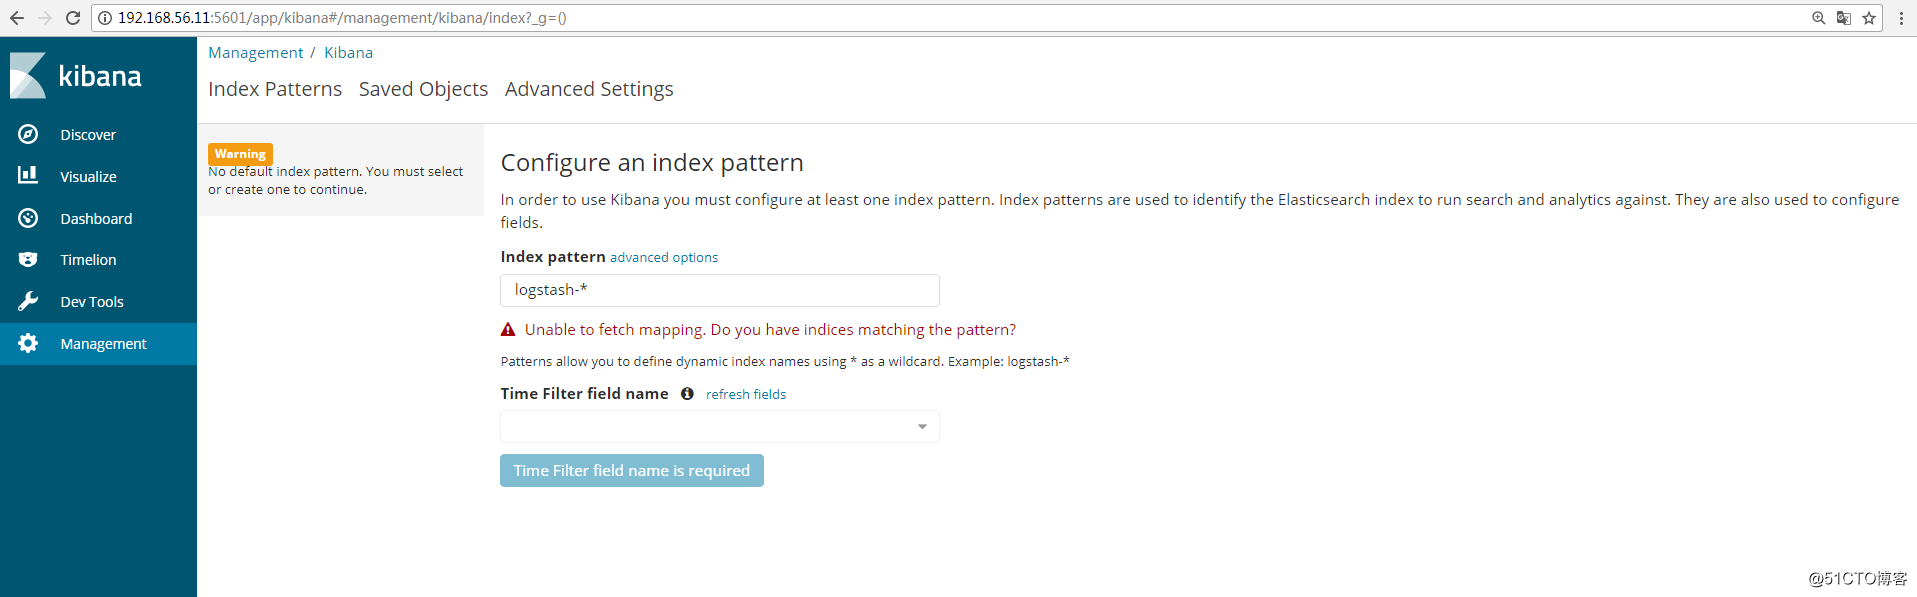
可以通过http://192.168.56.11:5601/status 来查看看是否正常,如果不正常,是无法进入到上图界面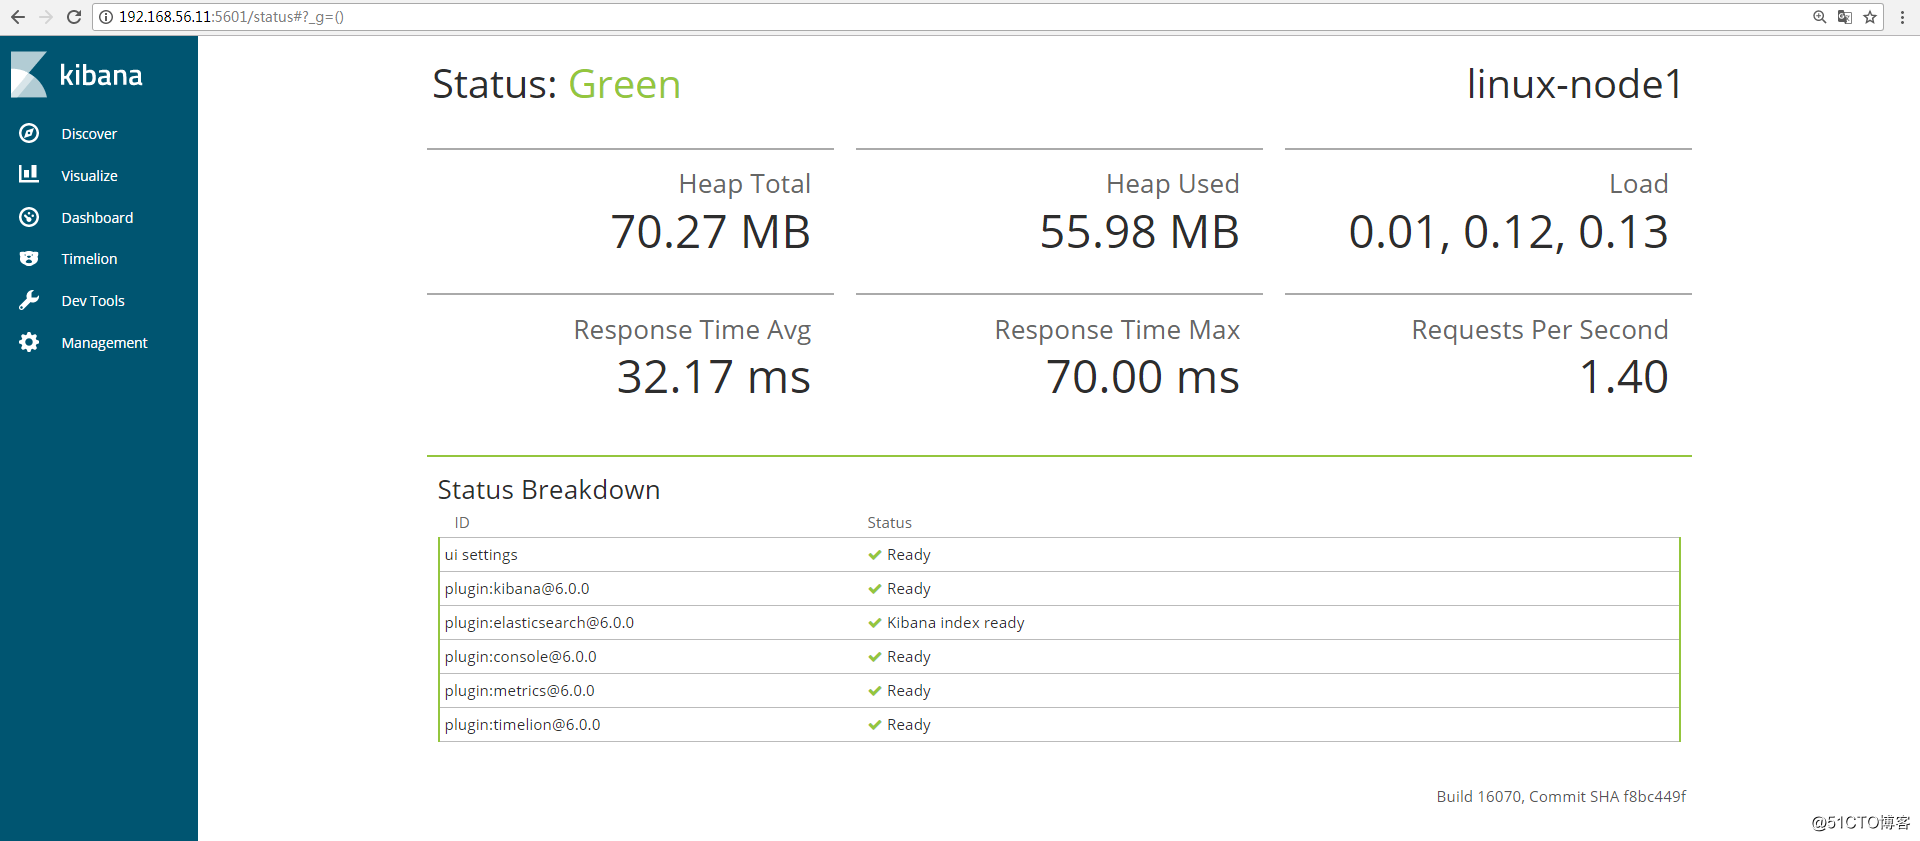
二、通过配置logstash文件收集message日志
1、Kibana展示上一节的日志
在Kibana上展示上一节收集的日志信息,添加索引,如图: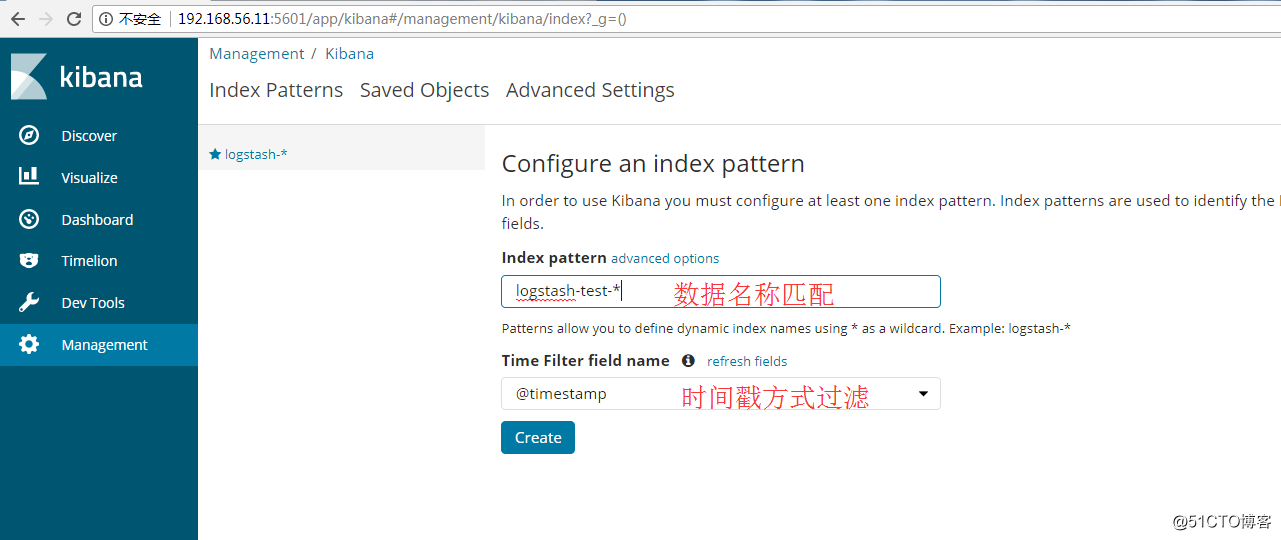
点击“discover”查看收集的信息,如图: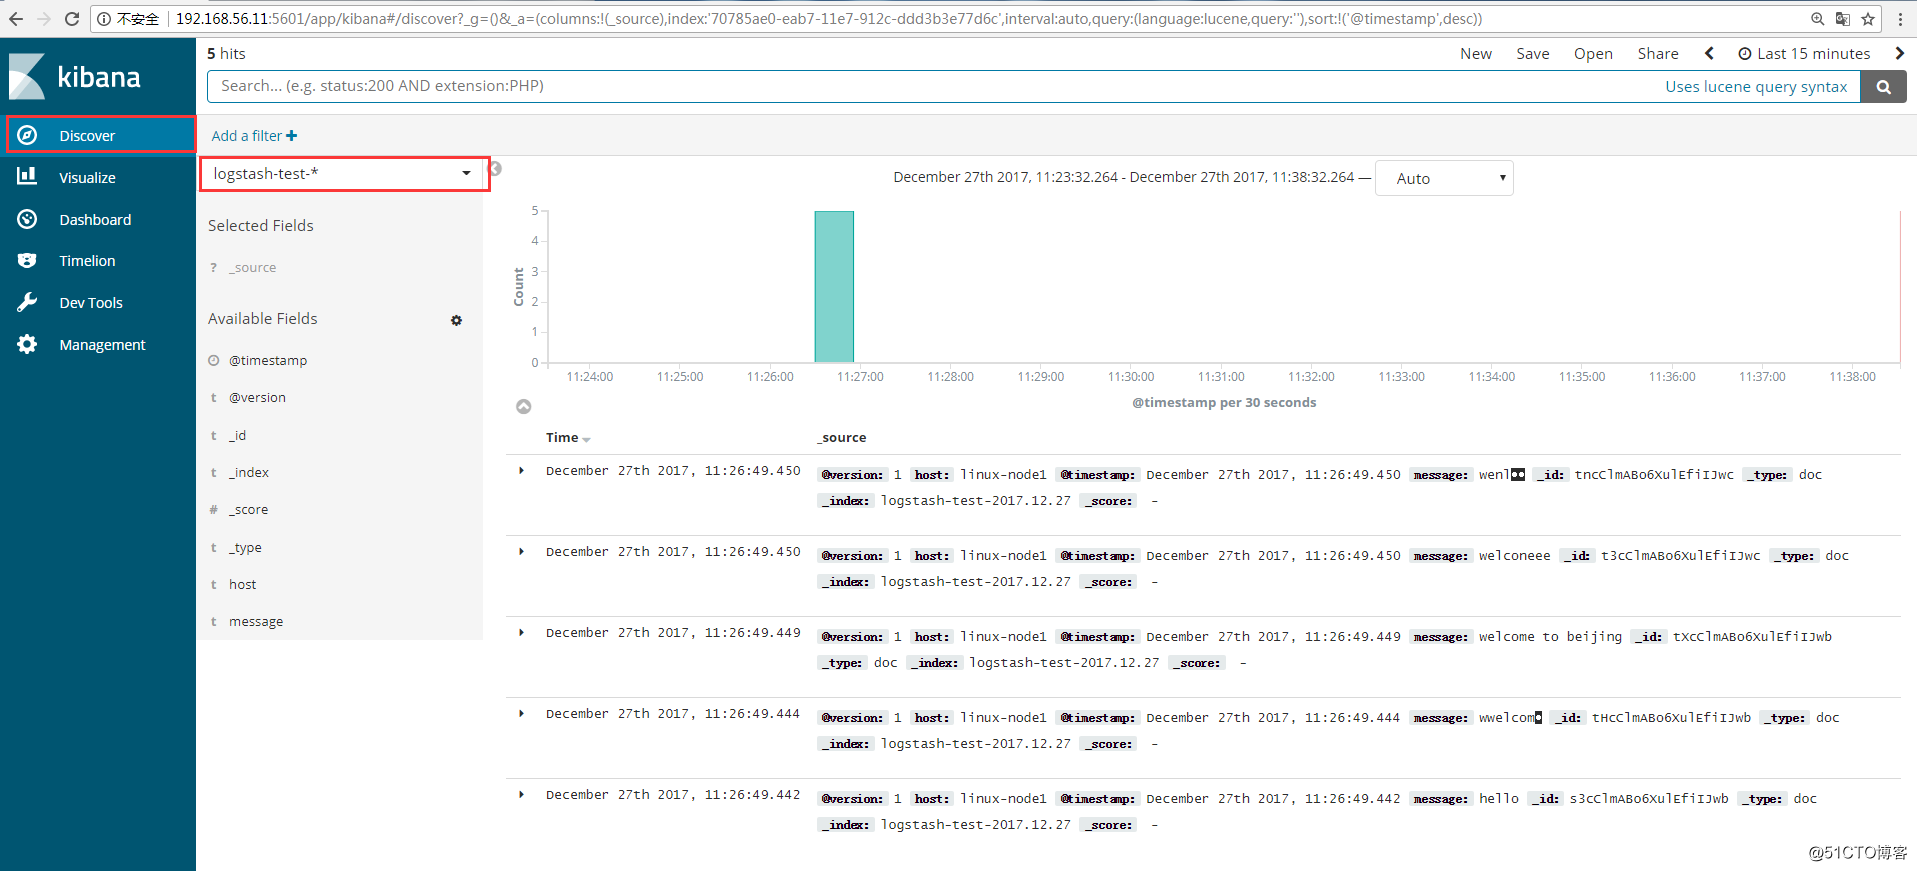
2、使用logstash配置文件收集messages日志
编辑logstash的配置文件:
[root@linux-node1 ~]# vim /etc/logstash/conf.d/system.conf
input {
  file {
    path => "/var/log/messages"     #日志路径
    type => "systemlog"      #类型
    start_position => "beginning"    #logstash 从什么位置开始读取文件数据,默认是结束位置,也就是说 logstash 进程会以类似 tail -F 的形式运行。如果你是要导入原有数据,把这个设定改成"beginning",logstash 进程就从头开始读取,类似 less +F 的形式运行。
    stat_interval => "2"  #logstash 每隔多久检查一次被监听文件状态(是否有更新) ,默认是 1 秒。
  }
}

output {
  elasticsearch {
    hosts => ["192.168.56.11:9200"]      #指定hosts
    index => "logstash-systemlog-%{+YYYY.MM.dd}"    #索引名称
  }

}
[root@linux-node1 ~]# /usr/share/logstash/bin/logstash -f /etc/logstash/conf.d/system.conf -t     #检测配置文件是否有语法错误
OpenJDK 64-Bit Server VM warning: If the number of processors is expected to increase from one, then you should configure the number of parallel GC threads appropriately using -XX:ParallelGCThreads=N
WARNING: Could not find logstash.yml which is typically located in $LS_HOME/config or /etc/logstash. You can specify the path using --path.settings. Continuing using the defaults
Could not find log4j2 configuration at path /usr/share/logstash/config/log4j2.properties. Using default config which logs errors to the console
Configuration OK
[root@linux-node1 ~]# ll /var/log/messages
-rw-------. 1 root root 791209 12月 27 11:43 /var/log/messages
#这里可以看到该日志文件是600权限,而elasticsearch是运行在elasticsearch用户下,这样elasticsearch是无法收集日志的。所以这里需要更改日志的权限,否则会报权限拒绝的错误。在日志中查看/var/log/logstash/logstash-plain.log 是否有错误。
[root@linux-node1 ~]# chmod 644 /var/log/messages
[root@linux-node1 ~]# systemctl restart logstash
在管理界面查看是否有相应的索引(logstash-systemlog-2017.12.27),如图: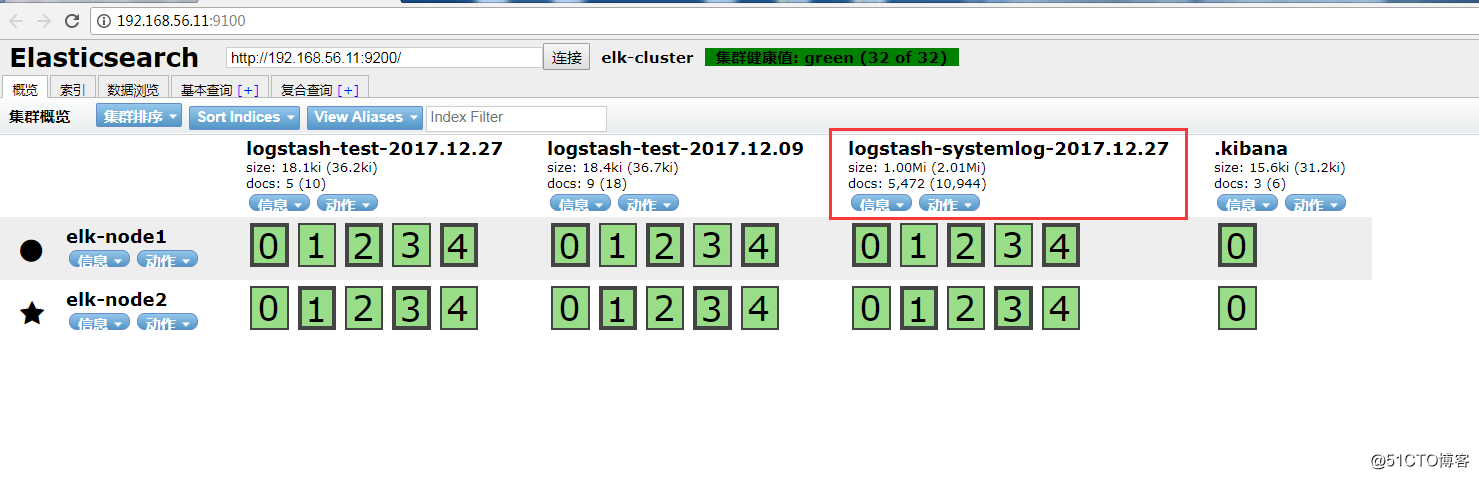
添加到Kibana中展示,创建索引: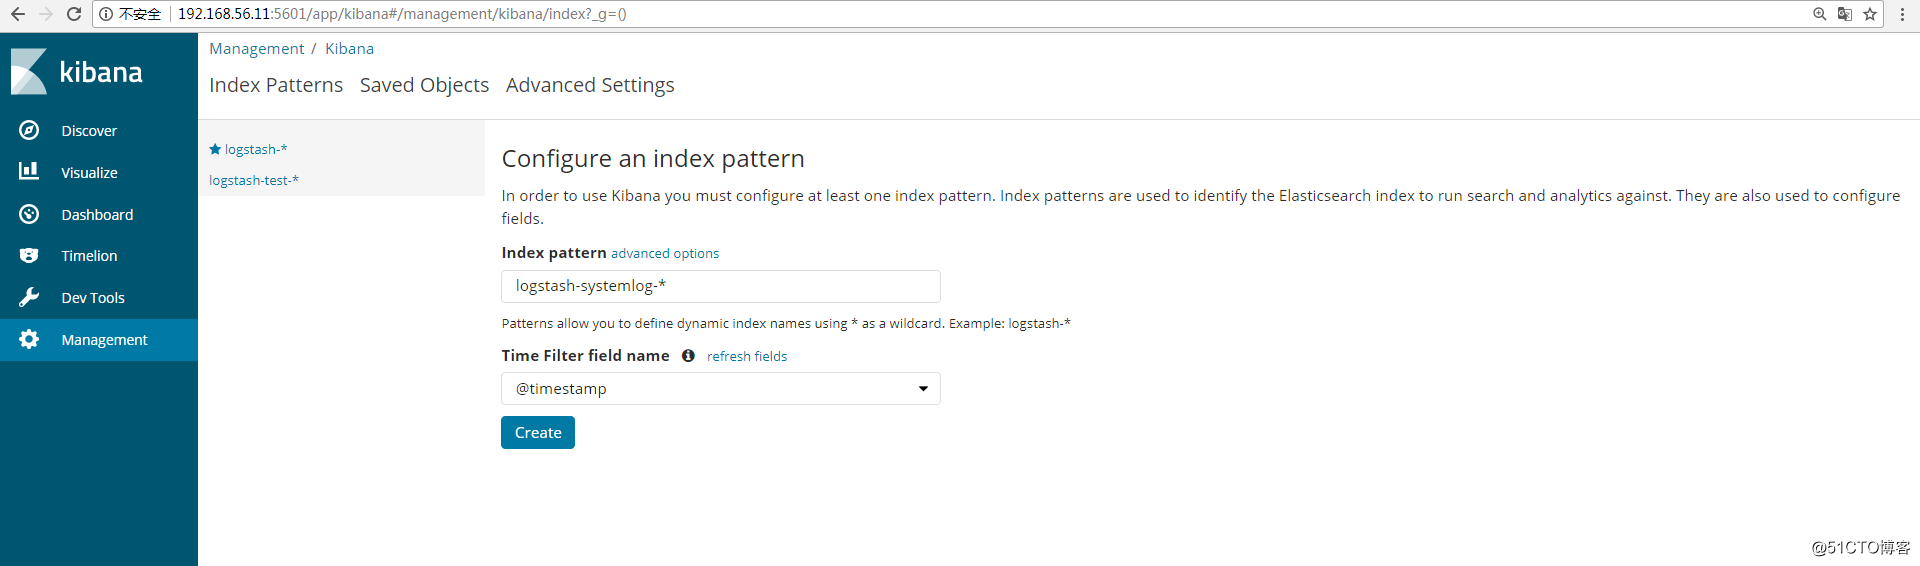
查看日志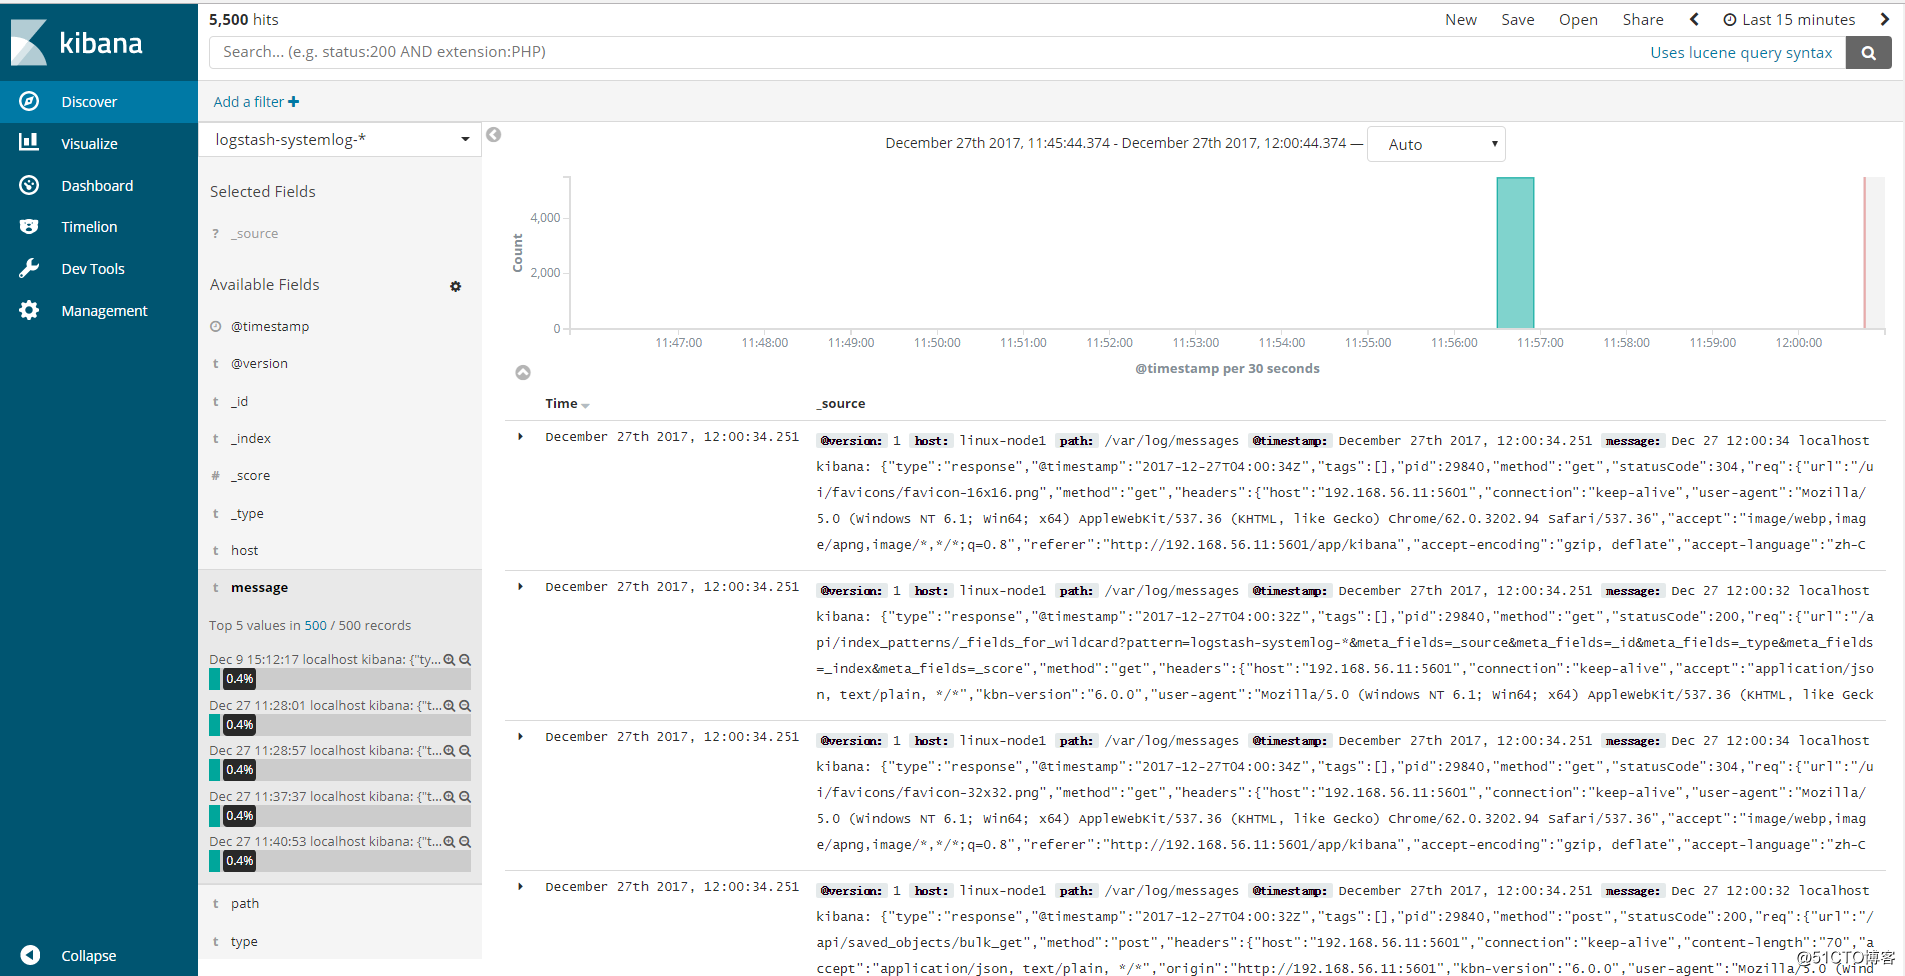
三、使用一个配置文件收集多个日志
修改logstash的配置文件,这里增加收集数据库mariadb的日志:
[root@linux-node1 ~]# vim /etc/logstash/conf.d/system.conf
input {
  file {
        path => "/var/log/messages"
        type => "systemlog"
        start_position => "beginning"
        stat_interval => "2"
  }
  file {
        path => "/var/log/mariadb/mariadb.log"
        type => "mariadblog"
        start_position => "beginning"
        stat_interval => "2"
  }
}

output {
  if [type] == "systemlog" {       #使用if来判断类型,并输出到elasticsearch和file,展示一个out可以作多样输出
  elasticsearch {
        hosts => ["192.168.56.11:9200"]
        index => "logstash-systemlog-%{+YYYY.MM.dd}"
  }
  file {
        path => "/tmp/logstash-systemlog-%{+YYYY.MM.dd}"

  }}
  if [type] == "mariadblog" {
  elasticsearch {
        hosts => ["192.168.56.11:9200"]
        index => "logstash-mariadblog-%{+YYYY.MM.dd}"
  }
  file {
        path => "/tmp/logstash-mariadblog-%{+YYYY.MM.dd}"
  }}

}
配置文件检测语法是否正常:
[root@linux-node1 ~]# /usr/share/logstash/bin/logstash -f /etc/logstash/conf.d/system.conf -t
OpenJDK 64-Bit Server VM warning: If the number of processors is expected to increase from one, then you should configure the number of parallel GC threads appropriately using -XX:ParallelGCThreads=N
WARNING: Could not find logstash.yml which is typically located in $LS_HOME/config or /etc/logstash. You can specify the path using --path.settings. Continuing using the defaults
Could not find log4j2 configuration at path /usr/share/logstash/config/log4j2.properties. Using default config which logs errors to the console
Configuration OK
重启logstash:
[root@linux-node1 ~]# systemctl restart logstash
修改mariadb的日志权限:
[root@linux-node1 ~]# ll /var/log/mariadb/ -d
drwxr-x--- 2 mysql mysql 24 12月  4 17:43 /var/log/mariadb/
[root@linux-node1 ~]# chmod 755 /var/log/mariadb/
[root@linux-node1 ~]# ll /var/log/mariadb/mariadb.log
-rw-r----- 1 mysql mysql 114993 12月 27 14:23 /var/log/mariadb/mariadb.log
[root@linux-node1 ~]# chmod 644 /var/log/mariadb/mariadb.log
通过head插件查看: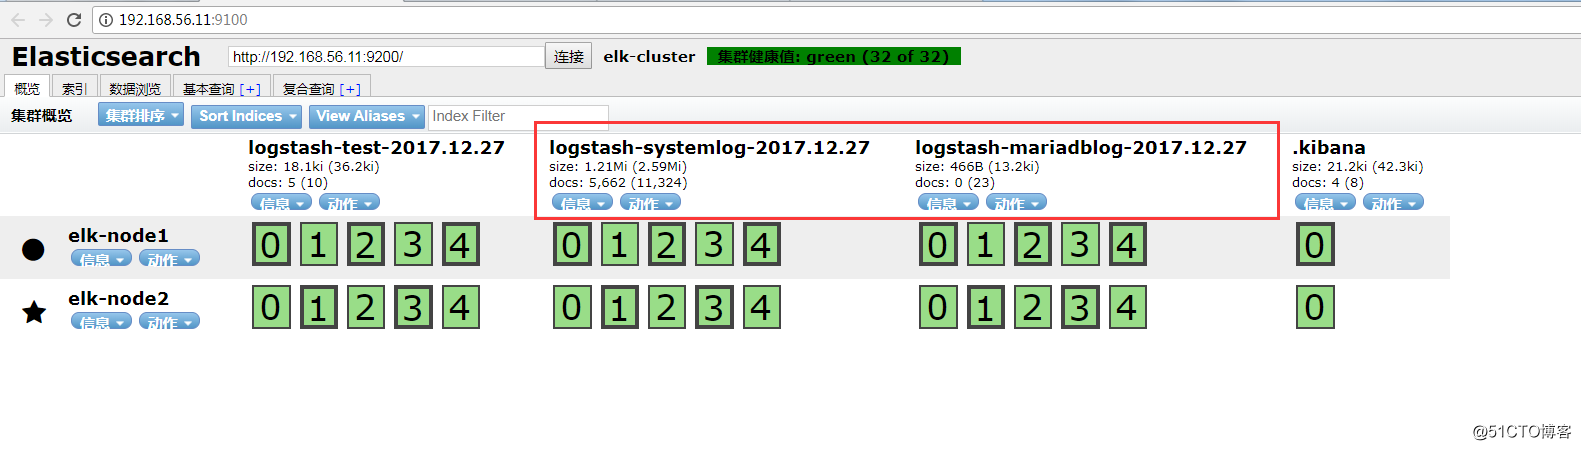
查看是否在/tmp下收集到了日志数据
[root@linux-node1 ~]# ll /tmp/logstash-*
-rw-r--r-- 1 logstash logstash 288449 12月 27 14:27 /tmp/logstash-mariadblog-2017.12.27
-rw-r--r-- 1 logstash logstash  53385 12月 27 14:28 /tmp/logstash-systemlog-2017.12.27
Kibana创建索引: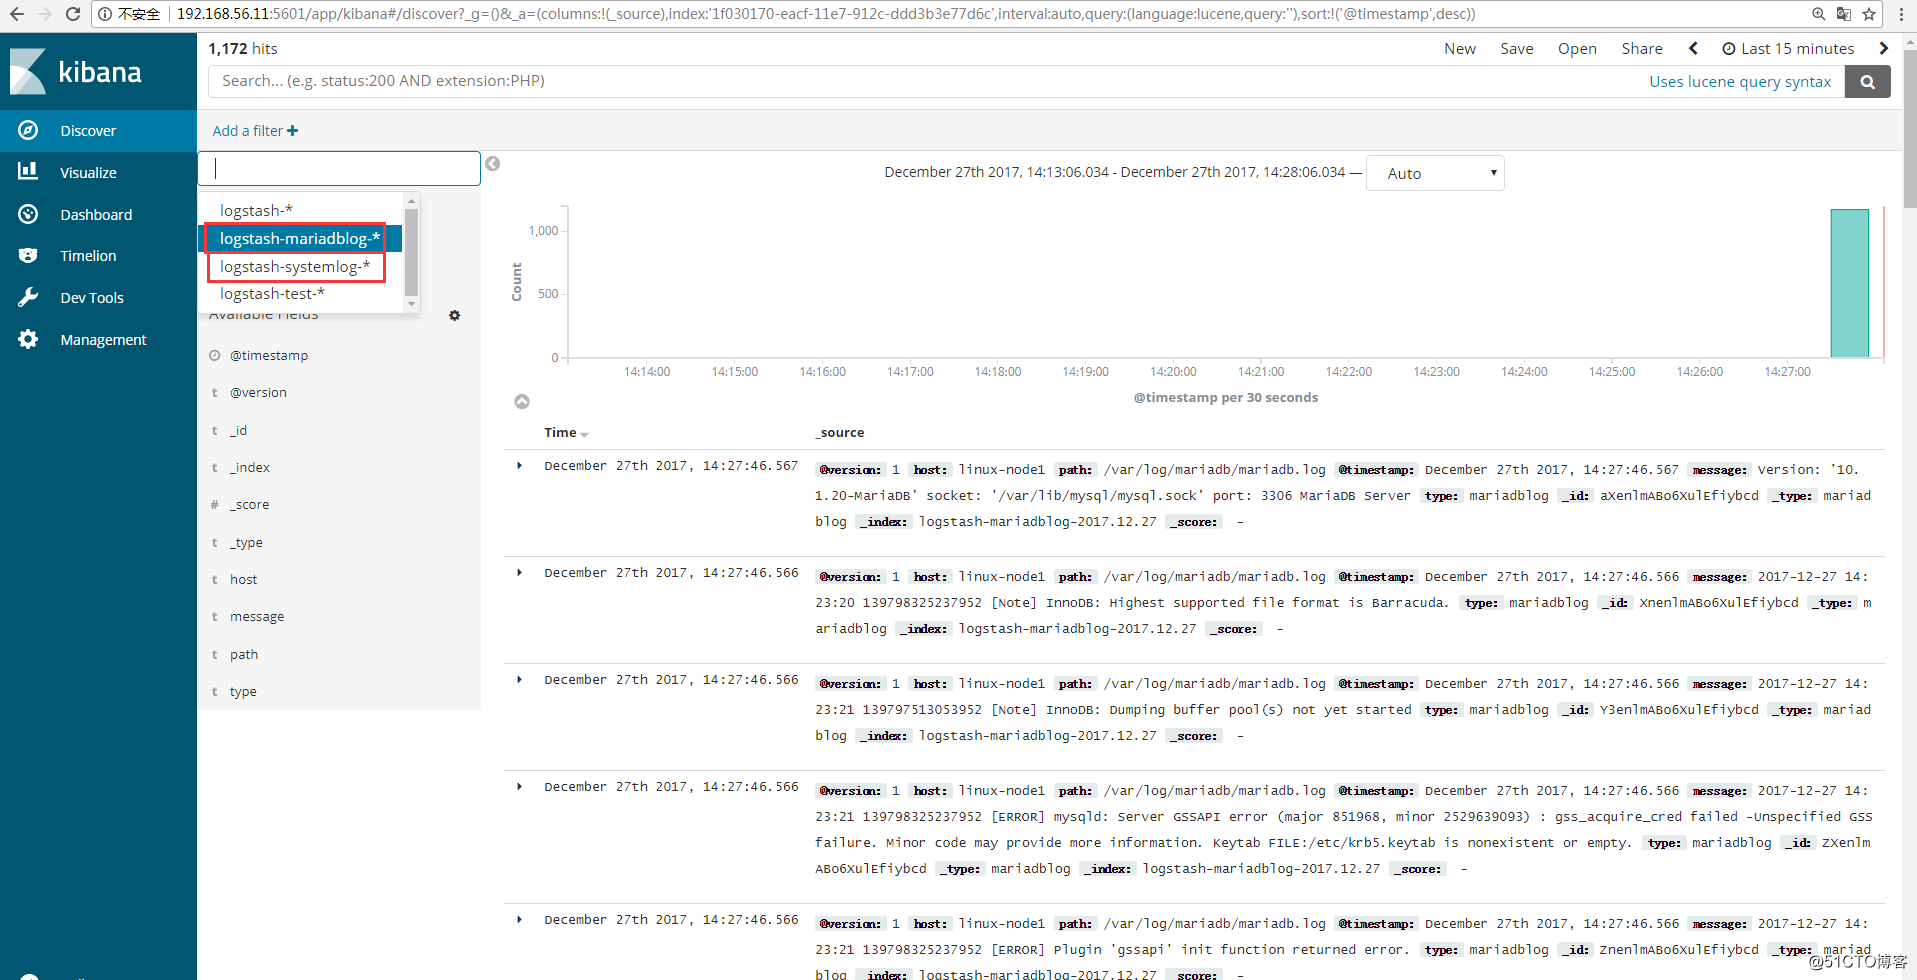
版权声明:原创作品,谢绝转载。否则将追究法律责任
本文转自 IT_外卖小哥 51CTO博客,原文链接:http://blog.51cto.com/jinlong/2055042
