If you search "0x000000c5" with Baidu, about 26,600 entries may turn up. But in the vast majority of the results, almost no one gives a reasonable and specific solution to each of the problem. In my opinion that once the blue screen occurs, if you want to solve, you should use WinDbg to find the culprit directly instead of taking a lot of time viewing the general solution the search engine provided.
So, first of all, let's take a look at what is the common 0x000000c5 crash.
The bug check with the value of 0x000000c5 is actually a DRIVER_CORRUPTED_EXPOOL. What does that mean? This indicates that the system attempted to access invalid memory at a process IRQL that was too high. On the blue screen, 0x000000c5 should be followed with four arguments in brackets, the first of which indicates the referenced memory address, the second indicates the IRQL at time of reference, the third is either 0 or 1 (0 represents read while 1 represents write), and the last indicates the address that referenced memory.
And then, what causes this error?
This problem is typically caused by a driver that has corrupted the system memory pool. If damage is less than a page size of the allocation units, then 0x000000c5 error will be raised; but if the drive makes a greater damaged area, then an error of DRIVER_CORRUPTED_MMPOOL will be shown, with a value of 0x000000D0.
How can I solve?
My advice is, be sure to enable the special pool! If you do not enable the special pool, we are unable to get the real culprit. And also, for issues within this kind, I recommend using a special pool. I do not have any preserved 0x000000c5 memory dump for the time being, but luckily there's a 0x100000C5 DRIVER_CORRUPTED_EXPOOL dump. Let me show you the stack information as follows:
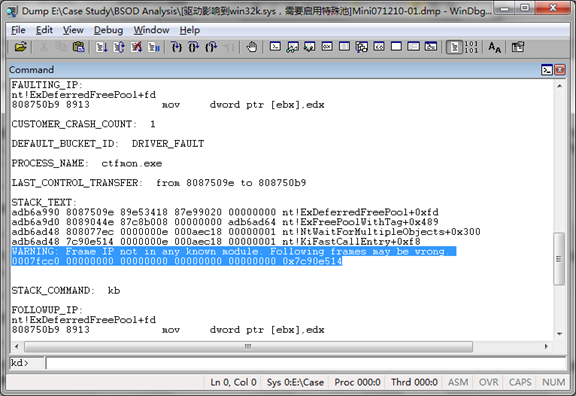
As we can see from the picture, 0x7c90e514 is not correctly resolved, and I can tell you that the address shown is not the real address value. It's a guessed address based on memory context by WinDbg. In this example, by using a "dds adb6ad48" command and then some repeated "dds" commands, we can only find a Microsoft Win32k.sys file, which is usually not the culprit. In order to allow us to reveal the real trouble-maker driver, we have to use the special pool.
What is a special pool and how it works?
Special pool is a special memory pool. Once activated, the system would be ready to keep an eye on the potential culprit driver. As for its principle, I will try to make a simple explanation. By enabling special memory pool, all the drivers that would be forced to receive a check by the system will get a special memory pool when they try to request buffer regions that are slightly less than a page size. They will not get paged or non-paged memory pool as usual. The buffer allocated from the special pool is sandwiched between two invalid pages. Therefore, for a buffer overflow that is less than a page size, the system will detects it and catches the right driver immediately once it occurs, because it leads to a page fault at the invalid page right after the buffer region. So when the system crashes again, the bug check should turns into DRIVER_PAGE_FAULT_BEYOND_END_OF_ALLOCATION (0x000000D6), which would allow WinDbg to have a greater chance to point out the faulty driver.
How to enable special pool?
1. Run "verifier.exe", you will see the Driver Verifier Manager wizard.
2. Select the second item – "create custom settings (for program developers)", and then click "Next".
3. Select the second item – "select individual settings from a complete list", and click "Next".
4. Only check the checkbox in front of the first item – "special pool", and move to the next step.
5. Select the third item – "automatically select all the drivers that are installed on this computer", and click "Finish".
6. Reboot the system to take effects.
After rebooting your system, special pool would have been in force. All the left to do is to try to reproduce the system crash that has occurred before. Then you should be able to find out the faulty driver by analyzing the newly generated dump file with the help of WinDbg.
The "verifier.exe" which is used in the above steps is right in your Windows system. It also comes with the Windows Driver Kit. If it still fails to reveal the driver that caused the crash, you can use the Global Flags utility gFlags to enable the special pool by pool tag and try again. The gFlags tool is in the installation directory of WinDbg (Debugging Tools for Windows).
References:
1. Debugging Help in Debugging Tools for Windows.
2. MSDN - Windows Driver Kit.
本文转自 hbycscc 51CTO博客,原文链接:http://blog.51cto.com/mvperic/488249