|
SQL Server 压力测试
2011-09-16
1265
版权
版权声明:
本文内容由阿里云实名注册用户自发贡献,版权归原作者所有,阿里云开发者社区不拥有其著作权,亦不承担相应法律责任。具体规则请查看《
阿里云开发者社区用户服务协议》和
《阿里云开发者社区知识产权保护指引》。如果您发现本社区中有涉嫌抄袭的内容,填写
侵权投诉表单进行举报,一经查实,本社区将立刻删除涉嫌侵权内容。
本文涉及的产品
简介:
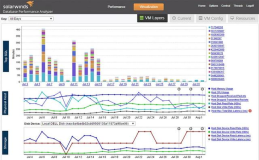
Stress Testing Your SQL Server Databases - A Systematic Approach
Stress Testing your SQL Server environments is a practice that can yield great benefits.
相关实践学习
SQL Server on Linux入门教程

目录
相关文章
|
SQL
传感器
监控
10款优秀的SQL Server服务器监控工具
服务器是网络中最重要的资源之一,SQL Server的广泛普及使SQL Server监控工具成为长期网络维护的先决条件。使用服务器监控工具跟踪服务器的运行状况可以为你提供解决性能问题所需的信息。
1468
1
1
|
SQL
存储
数据库
SQL Server基础
608
0
0
|
SQL
测试技术
数据库
SQL SERVER 2000 迁移后SQL SERVER代理服务启动错误分析
公司有一个老系统,这个系统所用的数据库是SQL SERVER 2000,它所在的Dell服务器已经运行超过10年了,早已经过了保修服务期,最近几乎每周会出现一次故障,加之5月份另外一台服务器坏了两个硬盘,所以非常担心这台服务器“寿终正寝”,跟开发维护那边沟通,想将数据库迁移升级到SQL SERVER 2008,但是由于是老旧系统,现在的负责人不敢做数据库升级,最终协商下来,只能迁移到另外一台服务器,不做升级。
1064
0
0
|
SQL
存储
BI
SQL Server学习3
SQL Server服务的管理
SQL Server服务
可以提供数据的存储,处理,受控访问,是SQL Server系统最基本的服务
SQL Server Analysis Server服务
为商业智能应用程序提供分析处理(OLAP,on-line analysis processing)和数据...
1235
0
0
|
SQL
存储
数据库
SQL Server优化50法
查询速度慢的原因很多,常见如下几种: 1、没有索引或者没有用到索引(这是查询慢最常见的问题,是程序设计的缺陷) 2、I/O吞吐量小,形成了瓶颈效应。 3、没有创建计算列导致查询不优化。
1048
0
0
|
SQL
数据库
监控
sql server 性能分析工具
1502
0
0
|
SQL
Go
索引
我如何调优SQL Server查询
1208
0
0
|
SQL
SQL Server关注的性能指标
1104
0
0
|
SQL
测试技术
数据库
使用UDL测试SQL Server连接问题
1394
0
0
|
SQL
SQL Server 压力测试
900
0
0