PyQt5 结合 matplotlib 时,如何显示其 NavigationToolbar
本文目的:展示 PyQt5 结合 matplotlib 时,如何显示其 NavigationToolbar。
本人搜遍所有网络无果,没办法,查看PyQt5源代码,最终才搞明白。。。特此留记。
〇、PyQt4 与 PyQt5 导入 NavigationToolbar 时的区别(去掉两个agg)
# PyQt4 版本(网传)
#from matplotlib.backends.backend_qt4agg import NavigationToolbar2QTAgg as NavigationToolbar


# PyQt5 版本
from matplotlib.backends.backend_qt5 import NavigationToolbar2QT as NavigationToolbar
一、隐藏 matplotlib 工具条


import sys
from PyQt5 import QtWidgets

from matplotlib.backends.backend_qt5agg import FigureCanvasQTAgg as FigureCanvas
from matplotlib.backends.backend_qt5 import NavigationToolbar2QT as NavigationToolbar
import matplotlib.pyplot as plt

import random

class Window(QtWidgets.QDialog):
    def __init__(self, parent=None):
        super().__init__(parent)

        self.figure = plt.figure()
        self.axes = self.figure.add_subplot(111)
        # We want the axes cleared every time plot() is called
        self.axes.hold(False)
        self.canvas = FigureCanvas(self.figure)


        self.toolbar = NavigationToolbar(self.canvas, self)
        self.toolbar.hide()

        # Just some button
        self.button1 = QtWidgets.QPushButton('Plot')
        self.button1.clicked.connect(self.plot)

        self.button2 = QtWidgets.QPushButton('Zoom')
        self.button2.clicked.connect(self.zoom)

        self.button3 = QtWidgets.QPushButton('Pan')
        self.button3.clicked.connect(self.pan)

        self.button4 = QtWidgets.QPushButton('Home')
        self.button4.clicked.connect(self.home)


        # set the layout
        layout = QtWidgets.QVBoxLayout()
        layout.addWidget(self.toolbar)
        layout.addWidget(self.canvas)

        btnlayout = QtWidgets.QHBoxLayout()
        btnlayout.addWidget(self.button1)
        btnlayout.addWidget(self.button2)
        btnlayout.addWidget(self.button3)
        btnlayout.addWidget(self.button4)
        qw = QtWidgets.QWidget(self)
        qw.setLayout(btnlayout)
        layout.addWidget(qw)

        self.setLayout(layout)

    def home(self):
        self.toolbar.home()
    def zoom(self):
        self.toolbar.zoom()
    def pan(self):
        self.toolbar.pan()

    def plot(self):
        ''' plot some random stuff '''
        data = [random.random() for i in range(25)]
        self.axes.plot(data, '*-')
        self.canvas.draw()

if __name__ == '__main__':
    app = QtWidgets.QApplication(sys.argv)

    main = Window()
    main.setWindowTitle('Simple QTpy and MatplotLib example with Zoom/Pan')
    main.show()

    sys.exit(app.exec_())
二、显示 matplotlib 工具条
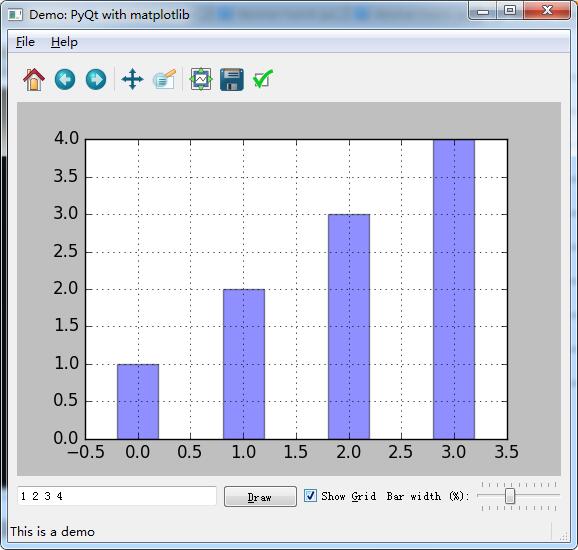
import sys, os, random

from PyQt5.QtCore import *
from PyQt5.QtGui import *
from PyQt5.QtWidgets import *

import matplotlib
matplotlib.use('Qt5Agg')
from matplotlib.backends.backend_qt5agg import FigureCanvasQTAgg as FigureCanvas
from matplotlib.backends.backend_qt5 import NavigationToolbar2QT as NavigationToolbar
from matplotlib.figure import Figure


class AppForm(QMainWindow):
    def __init__(self, parent=None):
        QMainWindow.__init__(self, parent)
        self.setWindowTitle('Demo: PyQt with matplotlib')

        self.create_menu()
        self.create_main_frame()
        self.create_status_bar()

        self.textbox.setText('1 2 3 4')
        self.on_draw()

    def save_plot(self):
        file_choices = "PNG (*.png)|*.png"

        path = QFileDialog.getSaveFileName(self,
                        'Save file', '',
                        file_choices)
        if path:
            self.canvas.print_figure(path, dpi=self.dpi)
            self.statusBar().showMessage('Saved to %s' % path, 2000)

    def on_about(self):
        msg = """ A demo of using PyQt with matplotlib:

         * Use the matplotlib navigation bar
         * Add values to the text box and press Enter (or click "Draw")
         * Show or hide the grid
         * Drag the slider to modify the width of the bars
         * Save the plot to a file using the File menu
         * Click on a bar to receive an informative message
        """
        QMessageBox.about(self, "About the demo", msg.strip())

    def on_pick(self, event):
        # The event received here is of the type
        # matplotlib.backend_bases.PickEvent
        #
        # It carries lots of information, of which we're using
        # only a small amount here.
        #
        box_points = event.artist.get_bbox().get_points()
        msg = "You've clicked on a bar with coords:\n %s" % box_points

        QMessageBox.information(self, "Click!", msg)

    def on_draw(self):
        """ Redraws the figure
        """
        #str = unicode(self.textbox.text())
        self.data = list(map(int, self.textbox.text().split()))

        x = range(len(self.data))

        # clear the axes and redraw the plot anew
        #
        self.axes.clear()
        self.axes.grid(self.grid_cb.isChecked())

        self.axes.bar(
            left=x,
            height=self.data,
            width=self.slider.value() / 100.0,
            align='center',
            alpha=0.44,
            picker=5)

        self.canvas.draw()

    def create_main_frame(self):
        self.main_frame = QWidget()

        # Create the mpl Figure and FigCanvas objects.
        # 5x4 inches, 100 dots-per-inch
        #
        self.dpi = 100
        self.fig = Figure((5.0, 4.0), dpi=self.dpi)
        self.canvas = FigureCanvas(self.fig)
        self.canvas.setParent(self.main_frame)

        # Since we have only one plot, we can use add_axes
        # instead of add_subplot, but then the subplot
        # configuration tool in the navigation toolbar wouldn't
        # work.
        #
        self.axes = self.fig.add_subplot(111)

        # Bind the 'pick' event for clicking on one of the bars
        #
        self.canvas.mpl_connect('pick_event', self.on_pick)

        # Create the navigation toolbar, tied to the canvas
        #
        self.mpl_toolbar = NavigationToolbar(self.canvas, self.main_frame)

        # Other GUI controls
        #
        self.textbox = QLineEdit()
        self.textbox.setMinimumWidth(200)
        self.textbox.editingFinished.connect(self.on_draw)

        self.draw_button = QPushButton("&Draw")
        self.draw_button.clicked.connect(self.on_draw)


        self.grid_cb = QCheckBox("Show &Grid")
        self.grid_cb.setChecked(False)
        self.grid_cb.stateChanged.connect(self.on_draw) #int

        slider_label = QLabel('Bar width (%):')
        self.slider = QSlider(Qt.Horizontal)
        self.slider.setRange(1, 100)
        self.slider.setValue(20)
        self.slider.setTracking(True)
        self.slider.setTickPosition(QSlider.TicksBothSides)
        self.slider.valueChanged.connect(self.on_draw)#int

        #
        # Layout with box sizers
        #
        hbox = QHBoxLayout()

        for w in [  self.textbox, self.draw_button, self.grid_cb,
                    slider_label, self.slider]:
            hbox.addWidget(w)
            hbox.setAlignment(w, Qt.AlignVCenter)

        vbox = QVBoxLayout()
        vbox.addWidget(self.mpl_toolbar)
        vbox.addWidget(self.canvas)
        vbox.addLayout(hbox)

        self.main_frame.setLayout(vbox)
        self.setCentralWidget(self.main_frame)

    def create_status_bar(self):
        self.status_text = QLabel("This is a demo")
        self.statusBar().addWidget(self.status_text, 1)

    def create_menu(self):
        self.file_menu = self.menuBar().addMenu("&File")

        load_file_action = self.create_action("&Save plot",
            shortcut="Ctrl+S", slot=self.save_plot,
            tip="Save the plot")
        quit_action = self.create_action("&Quit", slot=self.close,
            shortcut="Ctrl+Q", tip="Close the application")

        self.add_actions(self.file_menu,
            (load_file_action, None, quit_action))

        self.help_menu = self.menuBar().addMenu("&Help")
        about_action = self.create_action("&About",
            shortcut='F1', slot=self.on_about,
            tip='About the demo')

        self.add_actions(self.help_menu, (about_action,))

    def add_actions(self, target, actions):
        for action in actions:
            if action is None:
                target.addSeparator()
            else:
                target.addAction(action)

    def create_action(  self, text, slot=None, shortcut=None,
                        icon=None, tip=None, checkable=False,
                        signal="triggered()"):
        action = QAction(text, self)
        if icon is not None:
            action.setIcon(QIcon(":/%s.png" % icon))
        if shortcut is not None:
            action.setShortcut(shortcut)
        if tip is not None:
            action.setToolTip(tip)
            action.setStatusTip(tip)
        if slot is not None:
            action.triggered.connect(slot)
        if checkable:
            action.setCheckable(True)
        return action


def main():
    app = QApplication(sys.argv)
    form = AppForm()
    form.show()
    app.exec_()

if __name__ == "__main__":
    main()
本文转自罗兵博客园博客,原文链接:http://www.cnblogs.com/hhh5460/p/5189843.html
,如需转载请自行联系原作者
