octave:14> help plot
'plot' is a function from the file C:\Octave\Octave3.6.4_gcc4.6.2\share\octave\3.6.4\m\plot\plot.m
-- Function File: plot (Y)
-- Function File: plot (X, Y)
-- Function File: plot (X, Y, PROPERTY, VALUE, ...)
-- Function File: plot (X, Y, FMT)
-- Function File: plot (H, ...)
-- Function File: H = plot (...)
Produce two-dimensional plots.
产生一个二维图像。
Many different combinations of arguments are possible. The
simplest form is
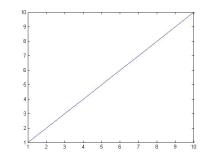
plot (Y)
where the argument is taken as the set of Y coordinates and the X
coordinates are taken to be the indices of the elements starting
with 1.
To save a plot, in one of several image formats such as PostScript
or PNG, use the `print' command.
If more than one argument is given, they are interpreted as
plot (Y, PROPERTY, VALUE, ...)
or
plot (X, Y, PROPERTY, VALUE, ...)
or
plot (X, Y, FMT, ...)
and so on. Any number of argument sets may appear. The X and Y
values are interpreted as follows:
* If a single data argument is supplied, it is taken as the set
of Y coordinates and the X coordinates are taken to be the
indices of the elements, starting with 1.
* If the X is a vector and Y is a matrix, then the columns (or
rows) of Y are plotted versus X. (using whichever
combination matches, with columns tried first.)
* If the X is a matrix and Y is a vector, Y is plotted versus
the columns (or rows) of X. (using whichever combination
matches, with columns tried first.)
* If both arguments are vectors, the elements of Y are plotted
versus the elements of X.
* If both arguments are matrices, the columns of Y are plotted
versus the columns of X. In this case, both matrices must
have the same number of rows and columns and no attempt is
made to transpose the arguments to make the number of rows
match.
If both arguments are scalars, a single point is plotted.
Multiple property-value pairs may be specified, but they must
appear in pairs. These arguments are applied to the lines drawn by
`plot'.
If the FMT argument is supplied, it is interpreted as follows. If
FMT is missing, the default gnuplot line style is assumed.
`-'
Set lines plot style (default).
`.'
Set dots plot style.
`N'
Interpreted as the plot color if N is an integer in the range
1 to 6.
`NM'
If NM is a two digit integer and M is an integer in the range
1 to 6, M is interpreted as the point style. This is only
valid in combination with the `@' or `-@' specifiers.
`C'
If C is one of `"k"' (black), `"r"' (red), `"g"' (green),
`"b"' (blue), `"m"' (magenta), `"c"' (cyan), or `"w"'
(white), it is interpreted as the line plot color.
`";title;"'
Here `"title"' is the label for the key.
`+'
`*'
`o'
`x'
`^'
Used in combination with the points or linespoints styles,
set the point style.
`@'
Select the next unused point style.
The FMT argument may also be used to assign key titles. To do so,
include the desired title between semi-colons after the formatting
sequence described above, e.g., "+3;Key Title;" Note that the last
semi-colon is required and will generate an error if it is left
out.
Here are some plot examples:
plot (x, y, "@12", x, y2, x, y3, "4", x, y4, "+")
This command will plot `y' with points of type 2 (displayed as
`+') and color 1 (red), `y2' with lines, `y3' with lines of color
4 (magenta) and `y4' with points displayed as `+'.
plot (b, "*", "markersize", 3)
This command will plot the data in the variable `b', with points
displayed as `*' with a marker size of 3.
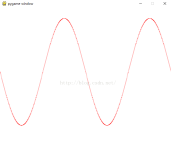
t = 0:0.1:6.3;
plot (t, cos(t), "-;cos(t);", t, sin(t), "+3;sin(t);");
This will plot the cosine and sine functions and label them
accordingly in the key.
If the first argument is an axis handle, then plot into these axes,
rather than the current axis handle returned by `gca'.
The optional return value H is a graphics handle to the created
plot.
See also: semilogx, semilogy, loglog, polar, mesh, contour, bar,
stairs, errorbar, xlabel, ylabel, title, print
Additional help for built-in functions and operators is
available in the online version of the manual. Use the command
'doc <topic>' to search the manual index.
Help and information about Octave is also available on the WWW
at http://www.octave.org and via the help@octave.org
mailing list.
本文转自ZH奶酪博客园博客,原文链接:http://www.cnblogs.com/CheeseZH/p/4047792.html,如需转载请自行联系原作者

![python绘图——绘制正负区分的柱形图[ax.bar()]](https://ucc.alicdn.com/pic/developer-ecology/rigajubvzf2hs_101a733110e44f18a0478db677e1a15f.png?x-oss-process=image/resize,h_160,m_lfit)