By Daniel Du
前面介绍了AIMS 2013中的性能分析报告工具,同时AIMS 2013也提供了对于的API,这篇文章就讲一下如何使用Profiling API,基本上是代码,不翻译了,如果哪里没看懂的话,评论里提一下。
In previous post, I introduce how to understand the result of performance report. In this post, I will introduce how to use the new profiling API, which makes it possible to create you own performance report.
In AIMS 2013 API, a new service is added, which is MgProfilingService, it is used to profile existing MapGuide APIs.
Here are two methods of MgProfilingService:
virtual MgByteReader * ProfileRenderDynamicOverlay (
MgMap *map,
MgSelection *selection,
MgRenderingOptions *options)=0
Profile the process of rendering all dynamic layers in the specified MgMap to a dynamic overlay image with a transparent background.
virtual MgByteReader * ProfileRenderMap (
MgMap *map,
MgSelection *selection,
MgCoordinate *center,
double scale,
INT32 width, INT32 height,
MgColor *backgroundColor,
CREFSTRING format,
bool bKeepSelection)=0
Profile the process of rendering a MgMap to the requested image format with specified center point and scale.
Now let's look at how to use these APIs to get detailed performance report information. AIMS API can be used in Java, PHP or .NET, I would like to use .NET here. Firstly create a AIMS custom WebApplication, and create a custom command to invoke an URL, which is an ASP.NET web page. Here is the source code of web page:
using System;
using System.Collections.Generic;
using System.Linq;
using System.Web;
using System.Web.UI;
using System.Web.UI.WebControls;
using OSGeo.MapGuide;
namespace HelloAIMS2013
{
publicpartialclassProfilingAPI : System.Web.UI.Page
{
protectedvoid Page_Load(object sender, EventArgs e)
{
UtilityClass util = newUtilityClass();
util.InitializeWebTier(HttpContext.Current.Request);
String sessionId = Request["SESSION"].ToString();
util.ConnectToServer(sessionId);
MgSiteConnection siteConn = util.GetSiteConnection();
MgResourceService resourceService = siteConn
.CreateService(MgServiceType.ResourceService)
asMgResourceService;
//Create MgProfilingService instance
MgProfilingService profilingService = siteConn
.CreateService(MgServiceType.ProfilingService)
asMgProfilingService;
//open current map
MgMap map = newMgMap();
if (Request["mapname"] != null)
{
string mapName = Request["mapname"].ToString();
map.Open(resourceService, mapName);
//remove base layer, profiling API doesn't apply to base layers
for (int i = 0; i < map.GetLayers().Count; i++)
{
MgLayerBase lyr = map.GetLayers().GetItem(i);
if (lyr.LayerType == MgLayerType.BaseMap)
{
map.GetLayers().Remove(lyr);
}
}
map.Save(resourceService);
#region sample 1, dome of ProfileRenderDynamicOverlay()
string format = "PNG";
// enum { RenderSelection = 1, RenderLayers = 2, KeepSelection = 4 }
// Rendering behavior values.
//RenderSelection - Renders the selected feature(s).
//RenderLayers - Renders the features on the map.
//KeepSelection - Renders the selected feature(s) even if they are outside the current scale.
int behavior = 2;
MgColor selectionColor = newMgColor(System.Drawing.Color.Blue);
MgRenderingOptions renderingOptions = newMgRenderingOptions(format,behavior, selectionColor);
MgByteReader byteReader = profilingService.ProfileRenderDynamicOverlay(
map,
null, //MgSelection, do not have selection here
renderingOptions);
//Store in a file
MgByteSink byteSink = newMgByteSink(byteReader);
byteSink.ToFile(@"c:\delete\profilingResult.txt");
Response.Write(@"write result to c:\delete\profilingResult.txt <br/>");
#endregion
#region Sample 2, demo of ProfileRenderMap
MgCoordinate center = map.ViewCenter.Coordinate;
double scale = map.ViewScale;
int width = Convert.ToInt32(map.GetDisplayWidth());
int height = Convert.ToInt32(map.GetDisplayHeight());
MgColor backgroundColor = newMgColor(map.GetBackgroundColor());
string format2 = "PNG";
bool bKeepSelection = true;
MgByteReader byteReader2 = profilingService.ProfileRenderMap(
map,
null,//MgSelection
center,
scale,
width,
height,
backgroundColor,
format2,
bKeepSelection);
//Store in a file
MgByteSink byteSink2 = newMgByteSink(byteReader2);
byteSink2.ToFile(@"c:\delete\profilingResult2.txt");
Response.Write(@"write result to c:\delete\profilingResult2.txt<br/>");
#endregion
}
}
}
}
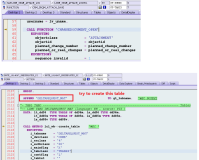
The code is selfexplanatory, it does performance report based on current map extent and current scale, and write the performance report result into a text file in XML format. These XML files include detailed information of performance. For example, you can find the total rendering time and time cost of each layer:

With these detailed information, you can implement your own performance report yourself.
If you want to know more about the performance report of AIMS Site Administrator, it is in PHP, all source code is released with the product, you can find then at <Infrastructure Web Server Extension 2013>\www\mapadmin.
OK, with that I draw an end to this post, do you think the profiling API is useful? You are welcome to leave us a comment below about your thought. We are always eager to hear from you.