【OS】OSWbb(OSWatcher Black Box)的简介和使用
OSWatcher Black Box, 简称OSW,是Oracle提供的一个小但是非常有用的工具,它通过调用OS自己提供的命令来记录OS运行时的一些性能参数,比如CPU/Memory/Swap/Network IO/Disk IO相关的信息。
+++ 为什么一定要部署OSW?
OSW并不是强制要部署的,并且有很多工具可以提供一样的功能,比如说mrtg, cacti, sar, nmon, enterprise manger grid control.
但是部署OSW有很多好处:
1. 它比较容易部署,并且容易删除。
2. 资源消耗比较小,不管是从CPU,内存还是磁盘空间来说。
3. 平时不需要维护,并且在发生问题时可以帮我们迅速定位问题是否发生在OS端
数据库是运行在OS之上的,如果OS发生了异常,那么数据库肯定也会受到影响;如果我们仅仅从数据库的角度去分析这样的问题时,很难有个好结果.
在平时的工作中,有一类问题很常见:在过去的某个时间段,数据库发生了一些问题,我们往往要找到问题的原因(root cause),之后才能做某些改动来避免它再次发生。对于这样的问题,OSW是非常有用的,举几个小例子:
1. 发生的问题并不是由于OS的异常引起的。这时候如果我们有在发生问题的时候收集的OSW数据,我们就可以立刻排除OS方面,把注意力投向DB/应用层。
2. 对于ORACLE Database Performance的问题,我们往往第一个方向就是排除OS的问题。
比如OS在某个时间段发生了很频繁的Swapping,那么内存相关的操作就会受到影响,数据库性能也会下降,表现在AWR中就会发现数据库有latch/mutex相关的等待。
3. 应用在某个时间段响应非常慢。AWR显示数据库非常的空闲,top5等待事件也都是很正常;从CPU,内存,Swap, Disk IO方面看也都很正常。后来发现OSW中关于网络的数据显示,发生问题时有非常多的丢包现象。如果当时没有收集到OSW的数据,那么基本上是不可能找到原因了。
4. 又比如某些ORA-04030的错误或者CJQ0, P00X, J00X进程不能启动的问题,如果我们部署了OSW,那么我们就能立刻知道这些错误是不是由于OS的内存短缺引起的。
5. 如果某个server process莫名hung住,我们可以通过OSW的信息来看当时这个进程是不是出于suspend的状态,是不是占用了太多的CPU/Memory。
6. 某些Listener hung的问题,我们也需要OSW的历史信息来进行下一步的分析。
7. Login Storm问题:客户的数据库系统突然变慢,从应用端,数据库的ASH,AWR报告中没有发现任何异常。但是通过OSW的ps的输出发现,在发生问题时, oracle 的server process比平时多了上千个。
实际上,OSW对于我们分析问题是非常有帮助的。如果当前OS上并没有部署任何的监控软件,那么强烈建议DBA来部署OSW。很多重要的生产环境都部署了OSW,在有关于DB Performance的问题时,他们往往会先提交OSW的输出。
+++ 大家对部署OSW的顾虑往往是:
1. 生产环境已经正常运行了很久了,基于稳妥的考虑,不能随便安装软件
2. OSW会不会带来副作用
OSW的工作机制是每隔一段时间调用OS提供的一些工具,比如ps, vmstat, netstat, mpstat, top;然后把这些工具的输出打印到文件里。 它不可避免的会消耗CPU, Disk IO, Disk Space, Memory;但是这些消耗的资源都是非常少的,在大部分的系统里都是可以忽略的。只有在某些极端情况下,部署OSW才会带来负面影响:系统已经是非常的忙,CPU使用率在90%以上;磁盘的free space已经没有了。所以大家的顾虑在大部分的情况下都是不必要的,部署OSW是没有什么风险的。
+++ 下面讲一下如何在UNIX/LINUX上安装/部署OSW:
1. 从文档301137.1上下载OSW
2. 随便放在某个地方(/tmp除外),然后解压缩。不需要用root权限
$ tar xvf osw.tar
3. 启动
$ nohup ./startOSWbb.sh 60 48 gzip &
这个命令的含义是,启动OSW,然后每隔60秒收集一下信息,总共保留最近的48小时的数据(历史数据会被自动清除),保留的数据是以gzip格式压缩的。
4. 如何关闭?
$ ./stopOSWbb.sh
收集的信息会存放在archive目录下。
Linux监控工具介绍系列——OSWatcher Black Box
2016-12-22 12:00 by 潇湘隐者, 1210 阅读, 1 评论, 收藏 , 编辑
OSWatcher Balck Box简介
OSWatcher Black Box (oswbb)是Oracle开发、提供的一个小巧,但是实用、强大的系统工具,它可以用来抓取操作系统的性能指标,用于辅助监控系统的资源使用。其安装部署、卸载都非常简单;资源消耗也比较小,原理也十分简单,它通过调用OS的的一些命令(例如vmstat、iostat等)来采集、存储CPU/Memory/Swap/Disk IO/Nentwork相关数据。安装和运行oswbba可以帮助在性能诊断时提供丰富多样的各类性能数据、图文报表支持。
OSWatcher 在4.0的版本时被命名为OSWatcher Black Box,简称为oswbb,同时增加了数据分析功能,即OSWatcher Black Box Analyzer (OSWbba)这个绘图和分析工具,其捆绑在 OS Watcher Black Box当中。替代了之前的OSWg。 也就是说在OSWatcher 4.0 之前是:OSWatcher 和 OSWg的关系,OSWatcher 4.0 后变成了: OSWbb 与 OSWbba 的关系。
OSWatcher Black Box(oswbb)支持多个操作系统,也分Linux与Window版本,当然这两个版本有所差别,本篇只讲述Linux版本。另外,OSWatcher Black Box(oswbb)由两个部分组成:
1. oswbb: 一个Unix的 shell script脚本集合,其用来收集和归档数据,从而帮助定位问题。
2. oswbba: 一个Java工具来自动分析数据,提供建议,并且生成一个包含图形的 html 文档。
OSWatcher Black Box(oswbb)的官方下载地址以及相关资料如下(Oracle Metalink上的资料需要账号)
How To Start OSWatcher Black Box (OSWBB) Every System Boot Using RPM oswbb-service(文档 ID 580513.1)
OSWatcher Analyzer User Guide (文档 ID 461053.1)
官方介绍文档对oswbb,oswbba的介绍如下:
OSWatcher (oswbb) is a collection of UNIX shell scripts intended to collect and archive operating system and network metrics to aid support in diagnosing performance issues. OSWatcher operates as a set of background processes on the server and gathers OS data on a regular basis, invoking such Unix utilities as vmstat, netstat and iostat. OSWatcher can be downloaded from this note. OSWatcher is also included in the RAC-DDT script file, but is not installed by RAC-DDT. For more information on RAC-DDT see RAC-DDT User Guide. OSWatcher is installed on each node where data is to be collected. Installation instructions for OSWatcher are provided in this user guide.
The OSWatcher Analyzer (oswbba) is a graphing and analysis utility which comes bundled with OSWatcher v4.0 and higher. oswbba allows the user to graphically display data collected, generate reports containing these graphs and provides a built in analyzer to analyze the data and provide details on any performance problems it detects. The ability to graph and analyze this information relieves the user of manually inspecting all the files.
NOTE: oswbba replaces the utility OSWg. This was done to eliminate the confusion caused by having multiple tools in support named OSWatcher. oswbba is only supported for data collected by oswbb and no other tool.
安装OSWatcher
Linux平台的安装简单到了不能再简单,如下所示,解压安装包生成oswbb文件夹。当然你最好将其部署或移动到合适的目录。
[oracle@DB-Server monitoring]$ tar -xvf oswbb734.tar
[oracle@DB-Server monitoring]$ ls -lrt
total 6196
drwxr-xr-x 6 oracle oinstall 4096 Jul 25 22:22 oswbb
-rw-r--r-- 1 oracle oinstall 6318080 Nov 8 02:33 oswbb734.tar
[oracle@DB-Server monitoring]$ cd oswbb
[oracle@DB-Server oswbb]$ ls –lrt

卸载OSWatcher
卸载OSWatche也是非常简单,只要稍懂Linux的应该都会。
1:卸载前先停止OSWatcher
./stopOSWbb.sh
2:删除OSWatcher的目录oswbb
rm –fr oswbb
启动OSWatcher
启动OSWatcher也非常简单,只需要执行startOSWbb.sh脚本即可,如下所示
./startOSWbb.sh 10 2
后面参数表示10秒采集一次数据,只保留最后采集2个小时的数据在归档文件中。首次启动的日志最好做一下检查,注意是否存在Warning信息,如下测试所示,检查时发现ifconfig命令找不到(oracle账户下无法运行ifconfig命令)
[oracle@DB-Server oswbb]$ ./startOSWbb.sh 10 2
[oracle@DB-Server oswbb]$ Setting the archive log directory to/home/oracle/monitoring/oswbb/archive
Testing for discovery of OS Utilities...
VMSTAT found on your system.
IOSTAT found on your system.
MPSTAT found on your system.
Warning... IFCONFIG not found on your system. No IFCONFIG data will be collected.
NETSTAT found on your system.
TOP found on your system.
Testing for discovery of OS CPU COUNT
oswbb is looking for the CPU COUNT on your system
CPU COUNT will be used by oswbba to automatically look for cpu problems
CPU COUNT found on your system.
CPU COUNT = 4
Discovery completed.
Starting OSWatcher v7.3.3 on Sun Dec 4 08:01:57 EST 2016
With SnapshotInterval = 10
With ArchiveInterval = 2
OSWatcher - Written by Carl Davis, Center of Expertise,
Oracle Corporation
For questions on install/usage please go to MOS (Note:301137.1)
If you need further assistance or have comments or enhancement
requests you can email me Carl.Davis@Oracle.com
Data is stored in directory: /home/oracle/monitoring/oswbb/archive
Starting Data Collection...
oswbb heartbeat:Sun Dec 4 08:02:02 EST 2016
oswbb heartbeat:Sun Dec 4 08:02:12 EST 2016
./startOSWbb.sh
如果没有指定参数,默认参数为30,48,意味着30秒采集一次数据,只保留最后48小时的数据到归档文件当中。其实startOSWbb.sh可以定义四个参数
参数1: 指定多少秒采集一次数据。
参数2: 指定采集的数据文件在归档路径保留多少个小时
参数3: 可选参数,打包压缩工具, 在完成收集后OSW 将使用其来打包压缩归档文件
参数4: 可选参数,指定采集归档数据的输出目录,默认为系统变量OSWBB_ARCHIVE_DEST的值。

使用上面方式启动OSWatcher,会被输出信息一直刷屏。基本上很少使用这种方式,一般使用nohup启动,这样可以让OSW能够在后台持续运行并在当前会话终止后不会被挂断。当然如果系统重启,那么OSWatcher就会停止。
nohup ./startOSWbb.sh 30 48 &
第一次启动OSWatcher会在oswbb目录下创建 gif、archive、tmp、locks目录。其归档文件夹和osw<工具名> 子文件夹会被建

OSWatcher采集的数据都存放在archive(目录路径)下,下面会生成oswiostat、oswmeminfo、oswmpstat等10个目录
[oracle@DB-Server archive]$ tree
.
|-- oswifconfig
|-- oswiostat
| |-- DB-Server.localdomain_iostat_16.12.09.1300.dat
| |-- DB-Server.localdomain_iostat_16.12.09.1400.dat
| `-- DB-Server.localdomain_iostat_16.12.09.1500.dat
|-- oswmeminfo
| |-- DB-Server.localdomain_meminfo_16.12.09.1300.dat
| |-- DB-Server.localdomain_meminfo_16.12.09.1400.dat
| `-- DB-Server.localdomain_meminfo_16.12.09.1500.dat
|-- oswmpstat
| |-- DB-Server.localdomain_mpstat_16.12.09.1300.dat
| |-- DB-Server.localdomain_mpstat_16.12.09.1400.dat
| `-- DB-Server.localdomain_mpstat_16.12.09.1500.dat
|-- oswnetstat
| |-- DB-Server.localdomain_netstat_16.12.09.1300.dat
| |-- DB-Server.localdomain_netstat_16.12.09.1400.dat
| `-- DB-Server.localdomain_netstat_16.12.09.1500.dat
|-- oswprvtnet
|-- oswps
| |-- DB-Server.localdomain_ps_16.12.09.1300.dat
| |-- DB-Server.localdomain_ps_16.12.09.1400.dat
| `-- DB-Server.localdomain_ps_16.12.09.1500.dat
|-- oswslabinfo
| |-- DB-Server.localdomain_slabinfo_16.12.09.1300.dat
| |-- DB-Server.localdomain_slabinfo_16.12.09.1400.dat
| `-- DB-Server.localdomain_slabinfo_16.12.09.1500.dat
|-- oswtop
| |-- DB-Server.localdomain_top_16.12.09.1300.dat
| |-- DB-Server.localdomain_top_16.12.09.1400.dat
| `-- DB-Server.localdomain_top_16.12.09.1500.dat
`-- oswvmstat
|-- DB-Server.localdomain_vmstat_16.12.09.1300.dat
|-- DB-Server.localdomain_vmstat_16.12.09.1400.dat
`-- DB-Server.localdomain_vmstat_16.12.09.1500.dat
10 directories, 24 files
采集的数据文件命名格式为OSWatcher 输出文件格式为:<节点名>_<操作系统工具名>_YY.MM.DD.HH24.dat 。如下所示,

配置OSWatcher自启动
OSWatcher在系统重启过后,是无法自动重启的,如果需要设置OSWatcher开机自启动,需要安装、配置osw-service这个RPM包。这个安装包可以从How To Start OSWatcher Black Box (OSWBB) Every System Boot Using RPM oswbb-service (文档 ID 580513.1)出下载。
[root@DB-Server tmp]# rpm -ivh oswbb-service-7.2.0-1.noarch.rpm
Preparing... ########################################### [100%]
1:oswbb-service ########################################### [100%]
[root@DB-Server tmp]#
安装osw-service这个RPM包后,需要配置/etc/oswbb.conf文件后,才能配置OSWatcher自启动。如下所示:

[root@DB-Server ~]#
[root@DB-Server ~]# /sbin/chkconfig oswbb on
[root@DB-Server ~]# /sbin/service oswbb start
Starting OSWatcher: [ OK ]
[root@DB-Server ~]#
关闭OSWatcher
关闭OSWatcher也是非常简单,网上有种说法:stopOSWbb.sh 是Oracle唯一支持的用于停止OSW的方法,其实不然,应该说有两种方法
1:执行脚本stopOSWbb.sh关闭OSWatcher
./stopOSWbb.sh
2:kill进程方法
[root@DB-Server ~]# ps -ef | grep -i OSW
oracle 24863 1 0 16:02 pts/1 00:00:00 /bin/sh ./OSWatcher.sh 30 48
oracle 24904 24863 0 16:03 pts/1 00:00:00 /bin/sh ./OSWatcherFM.sh 48 /home/oracle/monitoring/oswbb/archive
root 25330 18699 0 16:05 pts/2 00:00:00 grep -i osw
[root@DB-Server ~]# kill 24863
[root@DB-Server ~]# kill 24904
[root@DB-Server ~]# ps -ef | grep -i OSW
root 25342 18699 0 16:05 pts/2 00:00:00 grep -i osw
[root@DB-Server ~]#

如果你查看stopOSWbb.sh脚本,你会发现它停止OSWatcher也是通过kill OSWatcher program相关进程的方法,如下所示:
[oracle@DB-Server oswbb]$ more stopOSWbb.sh
#!/bin/sh
######################################################################
# stopOSW.sh
# This is the script which terminates all processes associated with
# the OSWatcher program.
######################################################################
# Kill the OSWatcher processes
######################################################################
PLATFORM=`/bin/uname`
case $PLATFORM in
AIX)
kill -15 `ps -ef | grep OSWatch | grep -v grep | awk '{print $2}'`
;;
*)
kill -15 `ps -e | grep OSWatch | awk '{print $1}'`
;;
esac
OSWatcher bba使用总结
OSWatcher now provides an analysis tool oswbba which analyzes the log files produced by OSWatcher. This tool allows OSWatcher to be selfanalyzing.
This tool also provides a graphing capability to graph the data and to produce a html profile. See the "Graphing and Analyzing the Output" section below.
oswbba is written in java and requires as a minimum java version 1.4.2 or higher. oswbba can run on any Unix X Windows or PC Windows platform. An X Windows environment is required because oswbba uses Oracle Chartbuilder which requires it.
OSWatcher bba 是一个Java语言写的应用程序,需要安装Java 1.4.2 或更高的版本。oswbba能够在任何有X Windows的Unix平台或Windows平台上运行, X Windows环境是必须的,因为oswbba需要用到Oracle Chartbuilder组件,而这个组件需要它。
[root@DB-Server oswbb]# java -version
java version "1.8.0_111"
Java(TM) SE Runtime Environment (build 1.8.0_111-b14)
Java HotSpot(TM) 64-Bit Server VM (build 25.111-b14, mixed mode)
[root@DB-Server oswbb]# java -jar oswbba.jar -i /home/oracle/monitoring/oswbb/archive/
或
[root@DB-Server oswbb]# java -jar Xmx512M oswbba.jar -i /home/oracle/monitoring/oswbb/archive/
如果你只想生成某个时间段的报表,你可以使用参数-B -E 如下案例所示
[root@DB-Server oswbb]#java -jar -Xmx256m oswbba.jar -i /home/oracle/scripts/oswbb/archive -B Dec 7 15:30:00 2016 -E Dec 7 17:00:00 2016
在处理过程OSWatcher有下面一些参数可供选择,如下所示。根据具体需要选择。 生成对应的html报表后,将其下载到本机,你就可以做一些分析了。

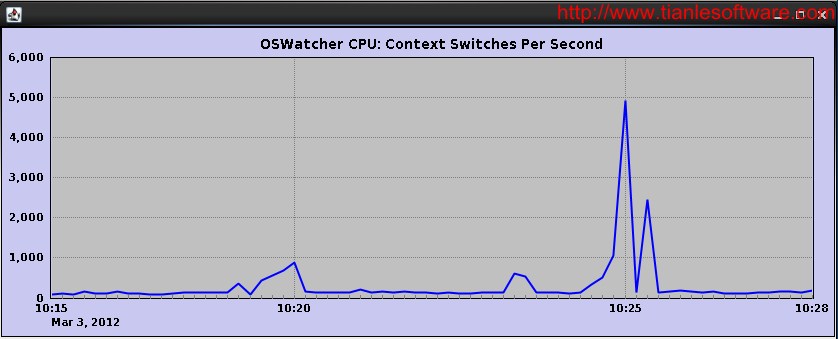
如下截图所示,这些图表仅仅是其中部分,OSWatcher给人印象最深的就是丰富的图表,而不是一堆枯燥的数字。


当然oswbba也能生成一个非常详细的分析报告,是文本格式,如下部分截图所示。

其实使用OSWatcher的使用并没有什么难度,反而是你要理解报表或分析报告中的指标意义,能够结合AWR、ASH以及其他数据库诊断信息来分析、诊断问题。这个才是有难度的。关于具体指标的详细说明,OSWatcher Analyzer User Guide (文档 ID 461053.1) 中已有详细解说,在此就不班门弄斧了。
OSWatcher常见应用问题
1: 如何判断OSWatcher是否正在运行
判断OSWatcher是否正在运行,非常简单,使用ps命令查看是否存在OSWatcher的相关进程即可。如下所示
[oracle@DB-Server ~]$ ps -ef | grep -i OSWatcher
oracle 23532 1 0 08:01 pts/2 00:00:14 /bin/sh ./OSWatcher.sh 10 2
oracle 23587 23532 0 08:02 pts/2 00:00:00 /bin/sh ./OSWatcherFM.sh 2 /home/oracle/monitoring/oswbb/archive
oracle 25808 24564 0 09:22 pts/3 00:00:00 grep --color=auto -i OSWatcher
[oracle@DB-Server ~]$
2: 没有设置JAVA环境变量,会遇到下面错误:
[oracle@mylnx02 oswbb]$ java -jar oswbba.jar -i /home/oracle/oswbb/archive -B Dec 21 09:00:00 2016 -E Dec 21 10:00:00 2016
Validating times in the archive...
Starting OSW Analyzer V7.3.3
OSWatcher Analyzer Written by Oracle Center of Expertise
Copyright (c) 2014 by Oracle Corporation
Parsing Data. Please Wait...
ERROR. You do not have a legitimate version of java in your PATH.
Linux users please download and install java from java.sun.com or
see the oswbba README for instructions on how to use the version of java
that comes shipped with the Oracle database.
如下所示,设置JAVA环境变量后,然后执行oswbba的相关命令即可。
[oracle@mylnx02 oswbb]$ export PATH=$ORACLE_HOME/jre/1.4.2/bin:$PATH
[oracle@mylnx02 oswbb]$ java -jar oswbba.jar -i /home/oracle/oswbb/archive -B Dec 21 09:00:00 2016 -E Dec 21 10:00:00 2016
Validating times in the archive...
Starting OSW Analyzer V7.3.3
OSWatcher Analyzer Written by Oracle Center of Expertise
Copyright (c) 2014 by Oracle Corporation
Parsing Data. Please Wait...
Scanning file headers for version and platform info...
Parsing file getlnx14.gfg1.esquel.com_iostat_16.12.21.0800.dat ...
Parsing file getlnx14.gfg1.esquel.com_iostat_16.12.21.0900.dat ...
3:运行"java -jar oswbba.jar ..."命令时报"Exception in thread "main" java.lang.OutOfMemoryError"
这个是因为JAVA的堆栈设置太小的缘故,加载到内存中的数据量过于庞大,需要设置参数-Xmx 可以用-Xmx256m或-Xmx512m 如下所示
java -jar -Xmx256m oswbba.jar -i /home/oracle/scripts/oswbb/archive
oswbba parses all the archive files in memory prior to generating graphs or performing an analysis. If you have a large amount of files to parse you may need to allocate more memory in the java heap. If you experience any error messages regarding out of memory such as java.lang.OutOfMemoryError, you may have to increase the size of the java heap. To increase the size of the java heap use the -Xmx flag.
4:oswbba是否可以在命令行界面生成html报告文件? 答案是可以,当然你会遇到很多杂七杂八问题,下面列举了一些我遇到的问题
1: ”No X11 DISPLAY variable was set, but this program performed an operation which requires it“

如果是root账号,只要执行export DISPLAY=:0.0命令后,即可在SecureCRT或 命令窗口生成报表文件。如下所示:
[root@DB-Server oswbb]# export DISPLAY=:0.0
[root@DB-Server oswbb]# java -jar oswbba.jar -i /home/oracle/monitoring/oswbb/archive/
Starting OSW Analyzer V7.3.3
OSWatcher Analyzer Written by Oracle Center of Expertise
Copyright (c) 2014 by Oracle Corporation
Parsing Data. Please Wait...
Scanning file headers for version and platform info...
Parsing file DB-Server.localdomain_iostat_16.12.04.0800.dat ...
Parsing file DB-Server.localdomain_iostat_16.12.04.0900.dat ...
Parsing file DB-Server.localdomain_vmstat_16.12.04.0800.dat ...
Parsing file DB-Server.localdomain_vmstat_16.12.04.0900.dat ...
Parsing file DB-Server.localdomain_netstat_16.12.04.0800.dat ...
Parsing file DB-Server.localdomain_netstat_16.12.04.0900.dat ...
Parsing file DB-Server.localdomain_top_16.12.04.0800.dat ...
Parsing file DB-Server.localdomain_top_16.12.04.0900.dat ...
Parsing file DB-Server.localdomain_ps_16.12.04.0800.dat ...
Parsing file DB-Server.localdomain_ps_16.12.04.0900.dat ...
Parsing Completed.
Enter 1 to Display CPU Process Queue Graphs
Enter 2 to Display CPU Utilization Graphs
Enter 3 to Display CPU Other Graphs
Enter 4 to Display Memory Graphs
Enter 5 to Display Disk IO Graphs
Enter 6 to Generate All CPU Gif Files
Enter 7 to Generate All Memory Gif Files
Enter 8 to Generate All Disk Gif Files
Enter L to Specify Alternate Location of Gif Directory
Enter T to Alter Graph Time Scale Only (Does not change analysis dataset)
Enter D to Return to Default Graph Time Scale
Enter R to Remove Currently Displayed Graphs
Enter A to Analyze Data
Enter S to Analyze Subset of Data(Changes analysis dataset including graph time scale)
Enter P to Generate A Profile
Enter X to Export Parsed Data to File
Enter Q to Quit Program
Please Select an Option:1
Enter 1 to Display CPU Process Queue Graphs
Enter 2 to Display CPU Utilization Graphs
Enter 3 to Display CPU Other Graphs
Enter 4 to Display Memory Graphs
Enter 5 to Display Disk IO Graphs
Enter 6 to Generate All CPU Gif Files
Enter 7 to Generate All Memory Gif Files
Enter 8 to Generate All Disk Gif Files
Enter L to Specify Alternate Location of Gif Directory
Enter T to Alter Graph Time Scale Only (Does not change analysis dataset)
Enter D to Return to Default Graph Time Scale
Enter R to Remove Currently Displayed Graphs
Enter A to Analyze Data
Enter S to Analyze Subset of Data(Changes analysis dataset including graph time scale)
Enter P to Generate A Profile
Enter X to Export Parsed Data to File
Enter Q to Quit Program
Please Select an Option:P
Enter a unique profile directory name or enter to accept default name:kkk.html
Generating file profile/DB-Server.localdomain_kkk.html/OSW_profile_files/OSWg_OS_Run_Queue.gif
Generating file profile/DB-Server.localdomain_kkk.html/OSW_profile_files/OSWg_OS_Block_Queue.gif
Generating file profile/DB-Server.localdomain_kkk.html/OSW_profile_files/OSWg_OS_Cpu_Idle.gif
Generating file profile/DB-Server.localdomain_kkk.html/OSW_profile_files/OSWg_OS_Cpu_System.gif
Generating file profile/DB-Server.localdomain_kkk.html/OSW_profile_files/OSWg_OS_Cpu_User.gif
Generating file profile/DB-Server.localdomain_kkk.html/OSW_profile_files/OSWg_OS_Cpu_Wa.gif
Generating file profile/DB-Server.localdomain_kkk.html/OSW_profile_files/OSWg_OS_Cpu_Interrupts.gif
Generating file profile/DB-Server.localdomain_kkk.html/OSW_profile_files/OSWg_OS_Context_Switches.gif
Generating file profile/DB-Server.localdomain_kkk.html/OSW_profile_files/OSWg_OS_Memory_Swap.gif
Generating file profile/DB-Server.localdomain_kkk.html/OSW_profile_files/OSWg_OS_Memory_Free.gif
Generating file profile/DB-Server.localdomain_kkk.html/OSW_profile_files/OSWg_OS_Memory_Page_In_Rate.gif
Generating file profile/DB-Server.localdomain_kkk.html/OSW_profile_files/OSWg_OS_IO_ST.gif
Generating file profile/DB-Server.localdomain_kkk.html/OSW_profile_files/OSWg_OS_IO_RPS.gif
Generating file profile/DB-Server.localdomain_kkk.html/OSW_profile_files/OSWg_OS_IO_WPS.gif
Generating file profile/DB-Server.localdomain_kkk.html/OSW_profile_files/OSWg_OS_IO_PB.gif
Generating file profile/DB-Server.localdomain_kkk.html/OSW_profile_files/OSWg_OS_IO_PBTP_1.gif
Generating file profile/DB-Server.localdomain_kkk.html/OSW_profile_files/OSWg_OS_IO_PBTP_2.gif
Generating file profile/DB-Server.localdomain_kkk.html/OSW_profile_files/OSWg_OS_IO_PBTP_3.gif
Generating file profile/DB-Server.localdomain_kkk.html/OSW_profile_files/OSWg_OS_IO_TPS.gif
上面使用的是root用户,如果是oracle用户,还是有可能还会遇到下面问题

此时需要切换到root账号,执行下面命令,然后切换到oracle用户下执行命令
[oracle@DB-Server oswbb]$ su - root
Password:
[root@DB-Server ~]# export DISPLAY=:0.0
[root@DB-Server ~]# xhost local:oracle
non-network local connections being added to access control list
当然,在SecureCRT中,你不能选择1-5这几个选项,否则依然会遇到 Can't connect to X11 window server using ':0.0'这个错误。这个只能在图形化界面才能执行。例如通过VNC来生成。

java -jar -Xmx256m oswbba.jar -i /home/oracle/oswbb/archive -B Mar 5 16:00:00 2016 -E Mar 5 16:30:00 2016
java -jar -Djava.awt.headless=true -Xmx256m oswbba.jar -i /home/oracle/oswbb/archive -B Mar 5 16:00:00 2016 -E Mar 5 16:30:00 2016

参考资料:
OSWatcher(包括:[视频]) (文档 ID 1526578.1)
| OSWatcher (Includes: [Video]) (文档 ID 301137.1) How To Start OSWatcher Black Box (OSWBB) Every System Boot Using RPM oswbb-service(文档 ID 580513.1) OSWatcher Analyzer User Guide (文档 ID 461053.1)
|
Oracle OS Watcher 工具 使用详解
一.OSWatcher 说明
OSWatcher 是Oracle 提供的一个用于操作系统监控的工具包,分Windows 和Linux 2个版本。
Linux 下的下载参考:OS Watcher Black Box UserGuide [ID 301137.1]
Windows平台下载:OSWatcher For Windows (OSWFW) User Guide [ID 433472.1]
也可以从我的CSDN 下载:
Oracle OS Watcher Tool
http://download.csdn.net/detail/tianlesoftware/4049989
OSWatcher hasbeen renamed to OSWatcher Black Box to avoid confusion as there are many toolsin support with this same name. This version is not to be confused with theversion of OSWatcher that is shipped with Exadata.
--OSWatcher 在4.0 版本被重命名为OSWatcherBlack Box,已避免造成与同名工具的疑惑。
New in thisrelease (4.0.0) is a built-in analyzer which analyzes the data OSWbb collectsand provides information on system slowdowns, hangs and other OS performanceproblems.
--在最新的4.0.0 版本,添加了收集分析数据的功能,在系统slowdown,hang 或者其他性能问题时会提供相关的分析数据。
OS Watcher BlackBox Analyzer (OSWbba) is a graphing and analysis utility which comes bundledwith OSWbb v4.0.0 and higher. OSWbba allows the userto graphically display data collected, generate reports containing these graphsand provides a built in analyzer to analyze the data and provide details on anyperformance problems it detects. The ability to graph and analyze thisinformation relieves the user of manually inspecting all the files.
-- OS Watcher Black Box Analyzer (OSWbba) 是一个绘图和分析工具,其捆绑在 OS Watcher Black Box(OSWbb)4.0中。
NOTE:OSWbbareplaces the utility OSWg. This was done to eliminate the confusion caused byhaving multiple tools in support named OSWatcher. OSWbba is only supported fordata collected by OSWbb and no other tool.
--OSWbba 替代了OSWg工具,已避免其和OSWatcher 工具的疑惑。OSWbba 仅仅用来支持OSWbb的数据收集,不做其他用途。
以上的说明感觉有点复杂,简单点说:
在OSW 4.0 之前是:OSWatcher 和 OSWg的关系。
OSW 4.0 后变成了: OSWbb 与 OSWbba 的关系。
这样避免造成名称上的疑惑。OSWbb收集数据,OSWbba 分析数据。
还有一个类似的工具OracleRDA:
OracleRDA(Remote Diagnostic Agent) 工具说明
http://blog.csdn.net/tianlesoftware/article/details/6758522
二.OS Watcher Black Box 安装配置
MOS:OS Watcher Black Box User Guide [ID 301137.1]
2.1 OSWbb 说明
OS Watcher BlackBox (OSWbb) is a collection of UNIX shell scripts intended to collect andarchive operating system and network metrics to aid support in diagnosingperformance issues. OSWbb operates as a set of background processes on theserver and gathers OS data on a regular basis, invoking such Unix utilities asvmstat, netstat and iostat. OSWbb can be downloaded from this note. OSWbb isalso included in the RAC-DDT script file, but is not installed by RAC-DDT. Formore information on RAC-DDT see <>. OSWbb is installed on each node wheredata is to be collected. Installation instructions for OSWbb are provided inthis user guide.
--OSWbb 是UNIX 脚本的集合,其用来收集和归档数据,从来来帮助定位问题。 OSWbb 操作可以设置为一个后台进程,然后规则的收集数据,其调用Unix 的工具,如vmstat,netstat和iostat。
OSWbb 包含了RAC-DDT脚本,但RAC-DDT 不包含OSWbb。
OSWbb consistsof a series of shell scripts. OSWatcher.sh is the main controlling executive,which spawns individual shell processes to collect specific kinds of data,using Unix operating system diagnostic utilities. Control is passed toindividually spawned operating system data collector processes, which in turncollect specific data, timestamp the data output, and append the data topre-generated and named files. Each data collector will have its own file,created and named by the File Manager process.
--OSWbb 包含一系列的shell 脚本。 OSWwaterch.sh 是总控制,其可以生成独立的shell 进程来收集不同的数据。
每个收集的信息都有自己独立的文件,文件名有时间戳。
Data collectionintervals are configurable by the user, but will be uniform for all datacollector processes for a single instance of the OSWbb tool. For example, ifOSWbb is configured to collect data once per minute, each spawned datacollector process will generate output for its respective metric, write data toits corresponding data file, then sleep for one minute (or other configuredinterval) and repeat. Because we are collecting data every minute, the filesgenerated by each spawned processes will contain 60 entries, one for eachminute during the previous hour. Each file will contain, at most, one hour ofdata. At the end of each hour, File Manager will wake up and copy the existingcurrent hour file to an archive location, then create a new current hour file.
--数据收集的间隔由用户配置,但对一个OSWbb 实例来说,其所有的收集进程的间隔时间是一样的。
The File Managerensures only the last N hours of information are retained,where N is a configurable integer defaulting to 48. File Manager willwake up once per hour to delete files older than N hours. At anytime, the entire output file set will consist of one current hour file,plus N archive files for each data collector process.
stopOSWbb.sh will terminate all processesassociated with OSWbb, and is the normal, graceful mechanism for stopping thetool's operation.
--File Manager 用来控制日志文件只保留最后N个小时的信息,这个N由用户配置,默认是48小时。File Manager 每隔一小时被唤醒一次,用来删除超过N小时的日志。
OSWbb invokesthese distinct operating system utilities, each as a distinct backgroundprocess, as data collectors. These utilities will be supported, or theirequivalents, as available for each supported target platform.
--OSWbb 直接调用系统命令来收集信息,每个收集的信息都对应一个后台进程,这些命令包括:
(1) ps
(2) top
(3) mpstat
(4) iostat
(5) netstat
(6) traceroute
(7) vmstat
2.2 Supported Platforms
OSWbb is certified to run on the followingplatforms:
--OSWbb 支持如下平台:
(1) AIX
(2) Tru64
(3) Solaris
(4) HP-UX
(5) Linux
2.3 Gathering DiagnosticData
2.3.1 Installing OSWbb
OSWbb needs tobe installed on each node, one installation per node. OSWbb should be installedmanually by using the following procedure:
--OSWbb 需要在每个节点上安装。从MOS上下载的OSWbb 是tar 文件,使用如下命令对tar 文件进行解压缩,就会得到一个OSWbb的文件夹。
[root@rac1 u01]#tar xvfoswbb.tar
oswbb 文件夹包含了所有需要的文件。解压缩的过程就是OSWbb的过程,也就是说,OSWbb 不需要安装,直接解压缩即可。
2.3.2 Uninstalling OSWbb
To de-installOSWbb issue the following command on the oswbb directory.
--卸载OSWbb,使用rm 命令移除整个文件夹即可,命令如下:
[root@rac1 u01]#rm -rf oswbb
2.3.3 Setting up OSWbb
Once OSWbb isinstalled, scripts have been provided to start and stop the OSWbb utility. WhenOSWbb is started for the first time it creates the archive subdirectory. Thearchive directory contains 7 subdirectories, one for each data collector. Datacollectors exist for top, vmstat, iostat, mpstat, netstat, ps and an optionalcollector for tracing private networks. To turn on data collection for privatenetworks the user must create an executable file in the oswbb directory namedprivate.net. An example of what this file should look like is named Exampleprivate.net with samples for each operating system: solaris, linux, aix, hp,etc. in the oswbb directory. This file can be edited and renamed private.net ora new file named private.net can be created. This file contains entries forrunning the traceroute command to verify RAC private networks.
--当OSWbb 安装完成之后,就可以使用start 和stop 脚本,在OSWbb第一次使用时,它会创建一些归档的子目录。 这些归档目录包含7个子目录,每一个子目录对应一个收集数据。 这7个目录分别对应:top, vmstat, iostat, mpstat, netstat, ps 和一个可选的traceprivate network。
要启动private network,必须先在oswbb目录下创建一个private.net的可执行文件。 这个文件里的内容可以是用来验证RAC private network的traceroute命令。
下面是Solaris平台下private.net示例:
Example private.net entry on Solaris:
traceroute -r -F node1
traceroute -r -F node2
Where node1 andnode2 are 2 nodes in addition to the hostnode of a 3 node RAC cluster. If thefile private.net does not exist or is not executable then no data will becollected and stored under the oswprvtnet directory.
OSWbb will needaccess to the OS utilities: top, vmstat, iostat, mpstat,netstat, and traceroute. These OS utilities need to be installon the system prior to running OSWbb. Execute permission on theseutilities need to be granted to the user of OSWbb.
--OSWbb 需要访问OS 命令,这些OS 命令需要在运行OSWbb之前安装好。
2.3.4 Starting OSWbb
To start theOSWbb utility execute the startOSWbb.sh shell script from the directory whereOSWbb was installed. This script has 2 arguments which control the frequencythat data is collected and the number of hour's worth of data to archive.
--启动OSWbb 功能用startOSWbb.sh 脚本。 这个脚本有2个脚本,其用来控制数据收集的频率和归档数据保留的时间。
ARG1 = snapshotinterval in seconds.
ARG2 = the number of hours of archive data to store.
If you do notenter any arguments the script runs with default values of 30 and 48 meaningcollect data every 30 seconds and store the last 48 hours of data in archive files.
--如果没有在启动时没有指定这2个参数,那么默认情况是30秒收集一次,归档数据保留48个小时。
--示例一
Example 1:
./startOSWbb.sh 60 10
This would startthe tool and collect data at 60 second intervals and log the last 10 hours ofdata to archive files.
--这个命令每隔60秒收集一次,数据保留10个小时。
Example 2:
./startOSWbb.sh
NOTE: This woulduse the default values of 30, 48 and collect data at 30 second intervals andlog the last 48 hours of data to archive files.
--没有指定参数,使用默认值
Example 3:
nohup ./startOSWbb.sh 60 10 &
This would startthe tool, put the process in the background, enable to the tool to continuerunning after the session has been terminated, collect data at 60 secondintervals, and log the last 10 hours of data to archive files.
--使用nohup让脚本后台执行。 更多内容,参考我的Blog:
http://blog.csdn.net/tianlesoftware/article/details/6165753
2.3.5 Stopping OSWbb
To stop theOSWbb utility execute the stopOSWbb.sh command from the directory where OSWbbwas installed. This terminates all the processes associated with the tool.
--停止OSWbb,使用stopOSWbb.sh 脚本即可。这个命令将终止所有相关的进程。
Example:
./stopOSWbb.sh
2.4 Diagnostic Data Output
--OSWbb 数据内容说明
As stated above,when OSWbb is started for the first time it creates the archive subdirectoryunder the OSWbb installation directory. The archive directory contains 7subdirectories, one for each data collector. These directories are namedoswiostat, oswmpstat, oswnetstat, oswprvtnet, oswps, oswtop, and oswvmstat. Onefile per hour will be generated in each of the 7 OS utility subdirectories withthe exception of oswprvtnet which is dependent on having private networkstracing configured. A new file is created at the top of each hour during thetime that OSWbb is running. The file will be in the following format:
--在第一次运行OSWbb时,会在OSWbb安装目录下创建7个子目录,分别对应7个不同的收集信息。这7个目录是:oswiostat, oswmpstat, oswnetstat, oswprvtnet,oswps, oswtop, and oswvmstat。 在7个目录中,每个一小时生成一个归档文件,这里除了private networks,因为其启动与否决定相关参数是否配置。 每个文件名的格式如下:
__YY.MM.DD.HH24.dat
rac1:/u01/oswbb> cd archive
rac1:/u01/oswbb/archive> ls
oswiostat oswmeminfo oswmpstat oswnetstat oswprvtnet oswps oswslabinfo oswtop oswvmstat
rac1:/u01/oswbb/archive> ll
total 36
drwxr-xr-x. 2 oracle oinstall 4096 Mar 3 21:04 oswiostat
drwxr-xr-x. 2 oracle oinstall 4096 Mar 3 21:04 oswmeminfo
drwxr-xr-x. 2 oracle oinstall 4096 Mar 3 21:04 oswmpstat
drwxr-xr-x. 2 oracle oinstall 4096 Mar 3 21:04 oswnetstat
drwxr-xr-x. 2 oracle oinstall 4096 Mar 3 21:04 oswprvtnet
drwxr-xr-x. 2 oracle oinstall 4096 Mar 3 21:04 oswps
drwxr-xr-x. 2 oracle oinstall 4096 Mar 3 21:04 oswslabinfo
drwxr-xr-x. 2 oracle oinstall 4096 Mar 3 21:04 oswtop
drwxr-xr-x. 2 oracle oinstall 4096 Mar 3 21:04 oswvmstat
rac1:/u01/oswbb/archive> cd oswiostat/
rac1:/u01/oswbb/archive/oswiostat> ls
rac1_iostat_12.03.03.2100.dat
Details about each type of data file can beviewed by clicking on the below links:
oswiostat
oswmpstat
oswnetstat
oswprvtnet
oswps
oswtop
oswvmstat
2.4.1 oswiostat
_iostat_YY.MM.DD:HH24.dat
These files willcontain output from the 'iostat' command that is obtained and archive byOSWatcher Black Box at specified intervals. These files will only existif 'iostat' is installed on the OS and if the OSWbb user has privileges to runthe utility.
The iostatcommand is used for monitoring system input/output device loading by observingthe time the physical disks are active in relation to their average transfer rates.This information can be used to change system configuration to better balancethe input/output load between physical disks and adapters.
--iostat 命令可以监控系统的I/O.
The iostatutility is fairly standard across UNIX platforms, but really on useful for thoseplatforms that support extended disk statistics: AIX, Solaris and Linux. Alsoeach platform will have a slightly different version of the iostat utility. Youshould consult your operating system man pages for specifics. The sampleprovided below is for Solaris.
OSWbb runs theiostat utility at the specified interval and stores the data in the oswiostatsubdirectory under the archive directory. The data is stored in hourly archivefiles. Each entry in the file contains a timestamp prefixed by *** embedded inthe iostat output. Notice there are 3 entries for each timestamp. You shouldalways ignore the first entry as this entry is always invalid. The second andthird entry will be valid but the second entry will be 1 sec later than thetimestamp and the third entry will be 2 seconds later than the timestamp.
| Sample iostat file produced by OSWbb |
||||||||||||||||||||||||||||||||||||||||||||||||||||||||||||||||||||||||||||||||||||||||
|
||||||||||||||||||||||||||||||||||||||||||||||||||||||||||||||||||||||||||||||||||||||||
2.4.1.1 Field Descriptions –字段描述
The iostat output contains summaryinformation for all devices.
| Field |
Description |
| r/s |
Shows the number of reads/second |
| w/s |
Shows the number of writes/second |
| kr/s |
Shows the number of kilobytes read/second |
| kw/s |
Shows the number of kilobytes written/second |
| wait |
Average number of transactions waiting for service (queue length) |
| actv |
Average number of transactions actively being serviced |
| wsvc_t |
Average service time in wait queue, in milliseconds |
| asvc_t |
Average service time of active transactions, in milliseconds |
| %w |
Percent of time there are transactions waiting for service |
| %b |
Percent of time the disk is busy |
| device |
Device name |
2.4.1.2 What to look for – 关注的内容
(1) Average service times greaterthan 20msec for long duration.
(2) High average wait times.
2.4.2 oswmpstat
_mpstat_YY.MM.DD:HH24.dat
These files willcontain output from the 'mpstat' command that is obtained and archive byOSWatcher Black Box at specified intervals. These files will only existif 'mpstat' is installed on the OS and if the OSWbb user has privileges to runthe utility.
The mpstat command collects and displays performancestatistics for all logical CPUs in the system.
--mpstat 命令收集和显示所有逻辑CPU的性能统计信息。
The mpstatutility is fairly standard across UNIX platforms. Each platform will have aslightly different version of the mpstat utility. You should consult youroperating system man pages for specifics. The sample provided below is forSolaris.
--每个平台都有不同版本的mpstat命令。
OSWbb runs thempstat utility at the specified interval and stores the data in the oswmpstatsubdirectory under the archive directory. The data is stored in hourly archivefiles. Each entry in the file contains a timestamp prefixed by *** embedded inthe mpstat output. Notice there are 3 entries for each timestamp. You shouldalways ignore the first entry as this entry is always invalid. The second andthird entry will be valid but the second entry will be 1 sec later than thetimestamp and the third entry will be 2 seconds later than the timestamp.
| Sample mpstat file produced by OSWbb |
||||||||||||||||||||||||||||||||||||||||||||||||||||||||||||||||||||||||||||||||
|
||||||||||||||||||||||||||||||||||||||||||||||||||||||||||||||||||||||||||||||||
2.4.2.1 Field Descriptions
| Field |
Description |
| cpu |
Processor ID |
| minf |
Minor faults |
| mif |
Major Faults |
| xcal |
Processor cross-calls (when one CPU wakes up another by interrupting it). |
| intr |
Interrupts |
| ithr |
Interrupts as threads (except clock) |
| csw |
Context switches |
| icsw |
Involuntary context switches |
| migr |
Thread migrations to another processor |
| smtx |
Number of times a CPU failed to obtain a mutex |
| srw |
Number of times a CPU failed to obtain a read/write lock on the first try |
| syscl |
Number of system calls |
| usr |
Percentage of CPU cycles spent on user processes |
| sys |
Percentage of CPU cycles spent on system processes |
| wt |
Percentage of CPU cycles spent waiting on event |
| idl |
Percentage of unused CPU cycles or idle time when the CPU is basically doing nothing |
2.4.2.2 What to look for
(1) Involuntary context switches(this is probably the more relevant statistic when examining performanceissues.)
(2) Number of times a CPU failed toobtain a mutex. Values consistently greater than 200 per CPU causes system timeto increase.
(3) xcal is very important, showprocessor migration
2.4.3 oswnetstat
_netstat_YY.MM.DD:HH24.dat
These files willcontain output from the 'netstat' command that is obtained and archive byOSWatcher Black Box at specified intervals. These files will only existif 'netstat' is installed on the OS and if the OSWbb user has privileges to runthe utility.
The netstat commanddisplays current TCP/IP network connections and protocol statistics.
--netstat 命令显示当前网络连接和协议的相关统计信息。
The netstatutility is standard across UNIX platforms. Each platform will have a slightlydifferent version of the netstat utility. You should consult your operatingsystem man pages for specifics. The sample provided below is for Solaris.
OSWbb runs thenetstat utility at the specified interval and stores the data in the oswnetstatsubdirectory under the archive directory. The data is stored in hourly archivefiles. Each entry in the file contains a timestamp prefixed by *** embedded inthe netstat output. Notice there are 3 entries for each timestamp. You shouldalways ignore the first entry as this entry is always invalid. The second andthird entry will be valid but the second entry will be 1 sec later than thetimestamp and the third entry will be 2 seconds later than the timestamp.
The netstatutility has many command line flags, and the most commonly used to troubleshootRAC is "ia(n)" for the interface level output and "s" forthe protocol level statistics. The following are examples for the two differentcommand parameters.
--netstat命令有写命令标记,常用来解决RAC 问题的是 ian 三个。 其含义如下:
The command line options "-ain"have these effects:
| Option |
Description |
| -a |
The command output will use the logical names of the interface. It will also report the name of the IP address found through normal IP address resolution methods. |
| -i |
This triggers the Interface specific statistics, the columns of which are outlined in table [bla-KR] |
| -n |
This causes the output to use IP addresses instead of the resolved names |
Example netstat file produced by OSWbb:
--输出示例,这里省略了大部分内容
| Sample netstat file produced by OSWbb |
||||||||||||||||||||||||||||||||||||||||||||||||||||||||||||||||||||||||||||||||||||||||||||||||||||||||||||||||||||||||||||||||||||||||||||||||||||||||||||||||||||||||||||||||||||||||||||||||||||||||||||||||||||
|
2.4.3.1 Field Descriptions:
The netstatoutput produced by OSWbb contains 2 sections. The first section containsinformation about all the network interfaces. The second section containsinformation about per-protocol statistics.
--netstat 输出包含两种类型,第一种包含所有network interfaces 的信息,第二种包含每个protocal 的统计信息。
(1)Section 1: Netstat -ain
| Field |
Description |
| name |
Device name of interface |
| Mtu |
Maximum transmission unit |
| Net |
Network Segment Address |
| address |
Network address of the device |
| ipkts |
Input packets |
| Ierrs |
Input errors |
| opkts |
Output Packets |
| Oerrs |
Output errors |
| collis |
Collisions |
| queue |
Number in the Queue |
(2)Section 2: Protocol Statistics
The per-protocol statistics can be dividedinto several categories:
--per-protocal 统计信息可以分成如下几类:
(1) RAWIP (raw IP) packets
(2) TCP packets
(3) IPv4 packets
(4) ICMPv4 packets
(5) IPv6 packets
(6) ICMPv6 packets
(7) UDP packets
(8) IGMP packet
Each protocoltype has a specific set of measures associated with it. Network analysisrequires evaluation of these measurements on an individual level and alltogether to examine the overall health of the network communications.
The TCP protocolis used the most in Oracle database and applications. Some implementations forRAC use UDP for the interconnect protocol instead of TCP. The statistics cannotbe divided up on a per-interface basis, so these should be compared to the"-i" statistics above.
2.4.3.1 What to look for: --注意内容
(1)Section 1
The informationin Section 1 will help diagnose network problems when there is connectivity butresponse is slow.
--这种类型的数据可以用来诊断网络连接正常,但是反应慢的情况:
Values to look at:
(1) Collisions (Collis)
(2) Output packets (Opkts)
(3) Input errors (Ierrs)
(4) Input packets (Ipkts)
The above values will give information toworkout network collision rates as follows:
1)Network collision rate = Output collision / Output packets
For a switchednetwork, the collisions should be 0.1 percent or less (see the Cisco web site as a reference) of the output packets.Excessive collisions could lead to the switch port the interface is pluggedinto to segment, or pull itself off-line, amongst other switch-related issues.
2)For the input error statistics:
Input Error Rate = Ierrs / Ipkts.
If the inputerror rate is high (over 0.25 percent), the host is excessively droppingpackets. This could mean there is a mismatch of the duplex or speed settings of the interface card and switch. It could also imply a failedpatch cable.
If ierrs oroerrs show an excessive amount of errors, more information can be found byexamination of the netstat -s output.
For Sun systems,further information about a specific interface can be found by using the"-k" option for netstat. The output will give fuller statistics forthe device, but this option is not mentioned in the netstat man page. Moreinformation can be found at http://sunsolve.sun.com.
(2)Section 2
The informationin Section 2 contains the protocol statistics.
Many performanceproblems associated with the network involve the retransmission of the TCPpackets. For retransmission rate calculations click here.
To find the segment retransmission rate:
%segment-retrans=(tcpRetransSegs /tcpOutDataSegs) * 100
To find the byte retransmission rate:
%byte-retrans = ( tcpRetransBytes /tcpOutDataBytes ) * 100
Most networkanalyzers report TCP retransmissions as segments (frames) and not in bytes.
2.4.4 oswprvtnet
_prvtnet_YY.MM.DD:HH24.dat
These files willcontain output from the 'prvtnet' command that is obtained and archived byOSWatcher Black Box at specified intervals. These files will only existif 'prvtnet' is installed on the OS and if the OSWbb user has privileges to runthe utility.
--这个文件包含prvtnet 命令收集的信息。
Informationabout the status of RAC private networks should be collected. This requires theuser to manually add entries for these private networks into the private.netfile located in the base oswbb directory. Instructions on how to do this arecontained in the README file.
--如果是RAC private network的信息,那么需要在private.net 文件里添加相关的内容。这个前面有示例。
OSWbb uses thetraceroute command to obtain the status of these private networks. Eachoperating system uses slightly different arguments to the traceroute command.Examples of the syntax to use for each operating system are contained in the sampleExample private.net file located in the base oswbb directory. This will resultin the output appearing differently across UNIX platforms. OSWbb runs theprivate.net file at the specified interval and stores the data in theoswprvtnet subdirectory under the archive directory. The data is stored inhourly archive files. Each entry in the file contains a timestamp prefixed by*** embedded in the top output.
| Sample file produced by OSWbb |
||
|
2.4.4.1 What to Look For
Example 1: Interface is up andresponding:
traceroute toX.X.X.X, (X.X.X.X) 30 hops max, 1492 byte packets
1 X.X.X.X 1.015 ms 0.766 ms 0.755 ms
Example 2: Target interface is not ona directly connected network, so validate that the address is correct or theswitch it is plugged in is on the same VLAN (or other issue):
traceroute to X.X.X.X, (X.X.X.X) 30 hopsmax, 40 byte packets
traceroute: host X.X.X.X is not on a directly-attached network
Example 3: Network is unreachable:
traceroute to X.X.X.X, (X.X.X.X) 30 hopsmax, 40 byte packets
Network is unreachable
2.4.5 oswps
_ps_YY.MM.DD:HH24.dat
These files willcontain output from the 'ps' command that is obtained and archive by OSWatcherBlack Box at specified intervals. These files will only exist if 'ps' isinstalled on the OS and if the OSWbb user has privileges to run the utility.
--这个文件包含ps命令的输出信息。
The ps (processstate) command list all the processes currently running on the system andprovides information about CPU consumption, process state, priority of theprocess, etc. The ps command has a number of options to control which processesare displayed, and how the output is formatted. OSWbb runs the ps command withthe -elf option.
The ps commandis fairly standard across UNIX platforms Each platform will have a slightlydifferent version of the ps utility. You should consult your operating systemman pages for specifics. The sample provided below is for Solaris.
OSWbb runs theps command at the specified interval and stores the data in the oswps subdirectoryunder the archive directory. The data is stored in hourly archive files. Eachentry in the file contains a timestamp prefixed by *** embedded in the psoutput.
| Sample ps file produced by OSWbb |
|||||||||||||||||||||||||||||||||||||||||||||||||||||||||||||||||||||||||||||||||||||||||||||||||||||||||||||||||||||||||||||||||||||||
|
|||||||||||||||||||||||||||||||||||||||||||||||||||||||||||||||||||||||||||||||||||||||||||||||||||||||||||||||||||||||||||||||||||||||
2.4.5.1 Field Descriptions
| Field |
Description |
| f |
Flags s State of the process |
| uid |
The effective user ID number of the process |
| pid |
The process ID of the process |
| ppid |
The process ID of the parent process. |
| d |
Processor utilization for scheduling (obsolete). |
| pri |
The priority of the process. |
| ni |
Nice value, used in priority computation. |
| addr |
The memory address of the process. |
| sz |
The total size of the process in virtual memory, including all mapped files and devices, in pages. |
| wchan |
The address of an event for which the process is sleeping (if blank, the process is running). |
| stime |
The starting time of the process, given in hours, minutes, and seconds. |
| tty |
The controlling terminal for the process (the message ?, is printed when there is no controlling terminal). |
| time |
The cumulative execution time for the process. |
| cmd |
The command name process is executing. |
2.4.5.2 What to look for
The informationin the ps command will primarily be used as supporting information for RACdiagnostics. If for example, the status of a process prior to a system crashmay be important for root cause analysis. The amount of memory a process isconsuming is another example of how this data can be used.
2.4.6 oswtop
_top_YY.MM.DD:HH24.dat
These files willcontain output from the 'top' command that is obtained and archive by OSWatcherat specified intervals. These files will only exist if 'top' is installedon the OS and if the OSWbb user has privileges to run the utility.
--这个文件包含top命令的信息。
Top is a programthat will give continual reports about the state of the system, including a listof the top CPU using processes. Top has three primary design goals:
(1) provide an accurate snapshot ofthe system and process state,
(2) not be one of the top processesitself,
(3) be as portable as possible.
Each operatingsystem uses a different version of the UNIX utility top. This will result inthe top output appearing differently across UNIX platforms. You should consultyour operating system man pages for specifics. The sample provided below is forSolaris.
OSWbb runs thetop utility at the specified interval and stores the data in the oswtopsubdirectory under the archive directory. The data is stored in hourly archivefiles. Each entry in the file contains a timestamp prefixed by *** embedded inthe top output.
| Sample top file produced by OSWbb |
|||||||||||||||||||||||||||||||||||||||||||||||||||||||||||||||||||||||||||||||||||||||||||||||||||||||||||||||||||||||||||||||||||||||||||||||||||||||||||||||||||||||||||||||||||||||||||
|
|||||||||||||||||||||||||||||||||||||||||||||||||||||||||||||||||||||||||||||||||||||||||||||||||||||||||||||||||||||||||||||||||||||||||||||||||||||||||||||||||||||||||||||||||||||||||||
2.4.6.1 Field Descriptions
(1)load averages: 0.11, 0.07, 0.0612:50:36
This linedisplays the load averages over the last 1, 5 and 15 minutes as well as thesystem time. This is quite handy as top basically includes a timestamp alongwith the data capture.
Load average isdefined as the average number of processes in the run queue. A runnable Unixprocess is one that is available right now to consume CPU resources and is notblocked on I/O or on a system call. The higher the load average, the more workyour machine is doing.
The threenumbers are the average of the depth of the run queue over the last 1, 5, and15 minutes. In this example we can see that .11 processes were on the run queueon average over the last minute, .07 processes on average on the run queue overthe last 5 minutes, etc. It is important to determine what the average load ofthe system is through benchmarking and then look for deviations. A dramaticrise in the load average can indicate a serious performance problem.
(2)136 processes: 133 sleeping, 2running, 1 on cpu
This linedisplays the total number of processes running at the time of the last update.It also indicates how many Unix processes exist, how many are sleeping (blockedon I/O or a system call), how many are stopped (someone in a shell hassuspended it), and how many are actually assigned to a CPU. This last numberwill not be greater than the number of processors on the machine, and the valueshould also correlate to the machine's load average provided the load averageis less than the number of CPUs. Like load average, the total number ofprocesses on a healthy machine usually varies just a small amount over time.Suddenly having a significantly larger or smaller number of processes could bea warning sign.
(3)Memory: 2048M real, 1061M free,542M swap in use, 1605M swap free
The"Memory:" line is very important. It reflects how much real and swapmemory a computer has, and how much is free. "Real" memory is theamount of RAM installed in the system, a.k.a. the "physical" memory."Swap" is virtual memory stored on the machine's disk.
Once a computerruns out of physical memory, and starts using swap space, its performancedeteriorates dramatically. If you run out of swap, you'll likely crash yourprograms or the OS.
(4)Individual process fields
| Field |
Description |
| PID |
Process ID of process |
| USERNAME |
Username of process |
| THR |
Process thread PRI Priority of process |
| NICE |
Nice value of process |
| SIZE |
Total size of a process, including code and data, plus the stack space in kilobytes |
| RES |
Amount of physical memory used by the process |
| STATE |
Current CPU state of process. The states can be S for sleeping, D for uninterrupted, R for running, T for stopped/traced, and Z for zombied |
| TIME |
The CPU time that a process has used since it started |
| %CPU |
The CPU time that a process has used since the last update |
| COMMAND |
The task's command name |
2.4.6.2 What to Look For
(1) Large run queue. Large numberof processes waiting in the run queue may be an indication that your systemdoes not have sufficient CPU capacity.
(2) Process consuming lots of CPU.A process which is "hogging" CPU is always suspect. If this processis an oracle foreground process it's most likely running an expensive querythat should be tuned. Oracle background process should not hog CPU for longperiods of time.
(3) High load averages. Processesshould not be backed up on the run queue for extended periods of time.
(4) Low swap space. This is anindication you are running low on memory.
2.4.7 oswvmstat
_vmstat_YY.MM.DD:HH24.dat
These files willcontain output from the 'vmstat' command that is obtained and archive byOSWatcher Black Box at specified intervals. These files will only existif 'vmstat' is installed on the OS and if the OSWbb user has privileges to runthe utility.
--这个文件包含vmstat 命令的内容。
The name vmstatcomes from "report virtual memory statistics". The vmstatutility does a bit more than this, though. In addition to reporting virtualmemory, vmstat reports certain kernel statistics about processes, disk, trap,and CPU activity.
The vmstatutility is fairly standard across UNIX platforms. Each platform will have aslightly different version of the vmstat utility. You should consult youroperating system man pages for specifics. The sample provided below is forSolaris.
OSWbb runs thevmstat utility at the specified interval and stores the data in the oswvmstatsubdirectory under the archive directory. The data is stored in hourly archivefiles. Each entry in the file contains a timestamp prefixed by *** embedded inthe vmstat output. Notice there are 3 entries for each timestamp. You shouldalways ignore the first entry as this entry is always invalid. The second andthird entry will be valid but the second entry will be 1 sec later than thetimestamp and the third entry will be 2 seconds later than the timestamp.
| Sample vmstat file produced by OSWbb |
||||||||||||||||||||||||||||||||||||||||||||||||||||||||||||||||||||||||||||||||||||||||||||||||||||||||||||||||||||||||||||||||||||
|
||||||||||||||||||||||||||||||||||||||||||||||||||||||||||||||||||||||||||||||||||||||||||||||||||||||||||||||||||||||||||||||||||||
2.4.7.1 Field Descriptions
The vmstatoutput is actually broken up into six sections: procs, memory, page, disk,faults and CPU. Each section is outlined in the following table.
| Field |
Description |
| PROCS |
|
| r |
Number of processes that are in a wait state and basically not doing anything but waiting to run |
| b |
Number of processes that were in sleep mode and were interrupted since the last update |
| w |
Number of processes that have been swapped out by mm and vm subsystems and have yet to run |
| MEMORY |
|
| swap |
The amount of swap space currently available free The size of the free list |
| PAGE |
|
| re |
page reclaims |
| mf |
minor faults |
| pi |
kilobytes paged in |
| po |
kilobytes paged out |
| fr |
kilobytes freed |
| de |
anticipated short-term memory shortfall (Kbytes) |
| sr |
pages scanned by clock algorithm |
| DISK |
|
| Bi |
Disk blocks sent to disk devices in blocks per second |
| FAULTS |
|
| In |
Interrupts per second, including the CPU clocks |
| Sy |
System calls |
| Cs |
Context switches per second within the kernel |
| CPU |
|
| Us |
Percentage of CPU cycles spent on user processes |
| Sy |
Percentage of CPU cycles spent on system processes |
| Id |
Percentage of unused CPU cycles or idle time when the CPU is basically doing nothing |
2.4.7.2 What to look for
The followinginformation should be used as a guideline and not considered hard and fastrules. The information documented below comes from Adrian Cockcroft's book, SunPerformance Tuning. Other operating systems like HP and Linux may havedifferent thresholds.
(1) Large run queue. AdrianCockcroft defines anything over 4 processes per CPU on the run queue as thethreshold for CPU saturation. This is certainly a problem if this last for anylong period of time.
(2) CPU utilization. The amount oftime spent running system code should not exceed 30% especially if idle time isclose to 0%.
(3) A combination of large runqueue with no idle CPU is an indication the system has insufficient CPUcapacity.
(4) Memory bottlenecks aredetermined by the scan rate (sr) . The scan rate is the pages scanned by theclock algorithm per second. If the scan rate (sr) is continuously over 200pages per second then there is a memory shortage.
(5) Disk problems may be identifiedif the number of processes blocked exceeds the number of processes on runqueue.
三. 配置OS Watcher 自启动
MOS:How To Start OSWatcher Black Box Every System Boot [ID 580513.1]
Oracle supportoften recommends that the OSWatcher Black Box(*) tool be run for an extendedperiod. Should the system reboot during this time, the systemadministrator must manually restart the OSWatcher, and allow it to run untilthe necessary data have been collected.
--OSW收集的信息越多,更有利用与系统的分析,所以我们可以设置OSW的自启动。
To automate thisprocedure, a simple shell script can be used. Care must be taken to avoidaccidentally overwriting the log data upon a restart. The scriptmust also ensure that the OSWatcher tool be run using the correct userprivileges.
--让OSW 自启动可以通过脚本来实现,但是要注意的问题就是要避免在故障启动后对原来日志的覆盖,因为这些数据对分析很重要,如果在OSW自动启
动时覆盖了这些历史数据,就不能帮助我们分析问题。
osw-service 包可以从MOS上下载,也可以从我的CSDN下载:
http://download.csdn.net/detail/tianlesoftware/4109807
Theosw-service RPM package provides a script to run the OSWatcher at system boot,and to stop it down gracefully at system shutdown. It provides an"osw" service that can be controlled using the standardLinux init(1) script controls:
--osw-service RPM 包提供了脚本让系统重启时运行OSWaterch,并且在系统shutdown时gracefully的stop。这个包提供了一个osw的服务来控制linux init(1)脚本:
# /sbin/chkconfig osw on
# /sbin/service osw start
The osw-service RPMpackage is available as an attachment to this note. Download and installit as any other RPM package. A source RPM is provided for completeness.
[root@rac1 OS Watcher Tool]# rpm -ivhosw_service_0_0_2_1_noarch.rpm
Preparing... ########################################### [100%]
1:osw-service ########################################### [100%]
Before startingthe service, first change the settings inthe /etc/sysconfig/osw configuration file to fit your situation:
--安装好osw service 后,在启动之前,需要修改/etc/sysconfig/osw的配置,具体如下:
# Set OSWHOME to the directory where yourOSWatcher tools are installed
OSWHOME=/u01/oswbb
# Set OSWINTERVAL to the number of secondsbetween collections
OSWINTERVAL=60
# Set OSRETENTION to the number of hours logs are to be retained
OSWRETENTION=1
# Set OSUSER to the owner of the OSWHOME directory
OSWUSER=oracle
Once this is done, the command:
--修改完毕就可以启动OSWatcher 自启动脚本:
# /sbin/service osw start
注意个问题:
[root@rac1 u01]# service osw start
Starting OSWatcher: bash: line 7:./startOSW.sh: No such file or directory
[FAILED]
因为OSWatcher 在4.0 以后做了修改,这里我们启动时报错,只需要将startOSWbb.sh 复制一份成startOSW.sh 就可以了。
rac1:/u01/oswbb> cp startOSWbb.sh startOSW.sh
will start the OSWatcher tool upon everyboot.
--之后每次系统重启,OSWatcher 都会自动启动。
The OSWatcherlogs will be stored in ${OSWHOME}/archive as normal. Whenthe osw-service is started, anyprior ${OSWHOME}/archive directory will be movedto ${OSWHOME}/archive- first.
--OSWatcher 的log 存储在${OSWHOME}/archive目录下,当osw-service 启动时,任何之前的${OSWHOME}/archive 目录都会先被移到${OSWHOME}/archive-目录,然后启动,这样就避免了日志被覆盖的可能型。
四.OS Watcher Black Box Analyzer安装配置
MOS:OS Watcher Black Box Analyzer User Guide [ID 461053.1]
我们用OSWatcher收集了数据存储到归档里,但是这些文件不利于分析,所以Oracle 提供了OSWbba工具,其可以分析OSWbb收集的数据并用图表展示出来。
OSWbba iswritten in java and requires as a minimum java version 1.4.2 or higher. OSWbbacan run on any Unix X Windows or PC Windows platform. An X Windows environmentis required because OSWbba uses Oracle Chartbuilder which requires it.
--OSWbba 是用java 写的,所以运行OSWbba 至少需要Java1.4.2 的版本。OSWbba 可以运行在任何平台下。
OSWbba parsesall the OSWbb vmstat, iostat and top utility log files contained in an archivedirectory. Once the data is parsed, the user is presented with a commandline menu which has options for both displaying graphs, creating binary giffiles of these graphs, generating an html report containing all the graphs withnarrative on what to look for, and new in this release, the ability toself-analyze the files OSWbb creates.
--OSWbb 通过vmstat,iostat等命令收集数据存放在归档目录里,OSWbba分析这些数据。 数据分析之后,用户就可以通过命令行目录来提取这些数据,可以选择图表或者生成图形的gif 文件,亦或html报告。
也就是说,OSWbba 对OSWbb 收集的数据进行一个图形的展现。
OSWbba is certified to run on the followingplatforms:
--OSWbba 可以在一下平台运行:
(1) AIX
(2) Solaris
(3) HP-UX
(4) Linux
(5) Windows XP
2.1 Installing OSWbba
OSWbba requiresno installation. It comes shipped as a standalone java jar file with OSWbbv4.0.0 and higher.
--OSWbba 不需要安装,其是一个独立的java 包。
2.2 Starting OSWbba
在启动OSWbba 工具之前,必须先安装java 1.4.2 或以上版本。 当然如果安装过了Oracle,那么oracle 安装目录里也有java。
[root@rac1oswbb]# su - oracle
rac1:/home/oracle>java -version
java version"1.6.0_20"
OpenJDK RuntimeEnvironment (IcedTea6 1.9.7) (rhel-1.39.1.9.7.el6-x86_64)
OpenJDK 64-BitServer VM (build 19.0-b09, mixed mode)
--我这里安装的java 是1.6 的版本。
如果使用Oracle的Java,那么需要修改一下环境变量,在Path里添加Java的路径,如:
PATH=$ORACLE_HOME/jdk/bin:$PATH
rac1:/u02/app/oracle/product/11.2.0/db_1/jdk/bin>./java -version
java version "1.5.0_30"
Java(TM) 2 Runtime Environment, StandardEdition (build 1.5.0_30-b03)
Java HotSpot(TM) 64-Bit Server VM (build1.5.0_30-b03, mixed mode)
--我这里的oracle是11.2.0.3,其自带的java 版本是1.5.
运行OSWbba 需要用-i 参数指定input 目录, 这里的目录是OSWbb log归档的全路径。这个归档目录必须和OSWbb 的目录结构相同,其必须包含其他的子目录,如oswvmstat,oswiostat, oswps, oswtop, oswnetstat 等。
--注意这里显示图片需要条用X windows,所以我们要在图形窗口中执行:
[root@rac1 u02]# xhost +
access control disabled, clients canconnect from any host
然后执行如下命令:
rac1:/u01/oswbb> java -jar oswbba.jar -i/u01/oswbb/archive
Starting OSW Black Box Analyzer V4.0
OSWatcher Black Box Analyzer Written byOracle Center of Expertise
Copyright (c) 2012 by Oracle Corporation
Parsing Data. Please Wait...
Parsing file rac1_iostat_12.03.03.2200.dat...
Parsing file rac1_vmstat_12.03.03.2200.dat...
Parsing file rac1_top_12.03.03.2200.dat ...
Parsing Completed.
Enter 1 to Display CPU Process Queue Graphs
Enter 2 to Display CPU Utilization Graphs
Enter 3 to Display CPU Other Graphs
Enter 4 to Display Memory Graphs
Enter 5 to Display Disk IO Graphs
Enter 6 to Generate All CPU Gif Files
Enter 7 to Generate All Memory Gif Files
Enter 8 to Generate All Disk Gif Files
Enter L to Specify Alternate Location ofGif Directory
Enter T to Specify Different Time Scale
Enter D to Return to Default Time Scale
Enter R to Remove Currently DisplayedGraphs
Enter P to Generate A Profile
Enter A to Analyze Data
Enter Q to Quit Program
Please Select an Option:2
这里按Q退出OSWbba。
相关分析的图形结果如下:
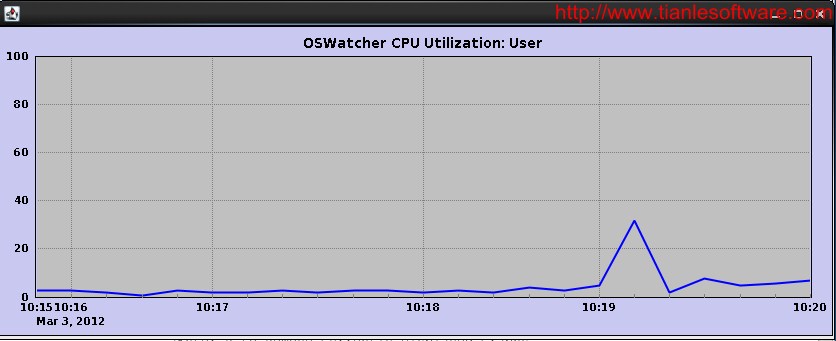
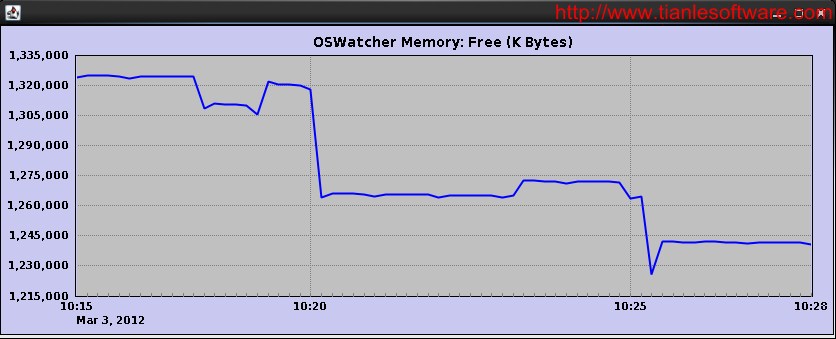
上面是在交互模式下进行,也可以使用命令行执行:
java -jar oswbba.jar -i -P -L -6 -7-8 -B -E
这里的参数,在上面有说明,6,7,8 是生成图片。
OSWbba parsesall the archive files in memory prior to generating graphs or performing ananalysis. If you have a large amount of files to parse you may need to allocatemore memory in the java heap. If you experience any error messages regardingout of memory such as java.lang.OutOfMemoryError, you may have to increase thesize of the java heap. To increase the size of the java heap use the -Xmx flag.
--OSWbba 解析所有的归档文件在内存中进行,然后生成图表,如果有大量的文件需要解析,可以指定java heap 大小。
$java -jar -Xmx512M OSWbba.jar -i /u01/oswbb/archive
Starting OSWbba V4.0.0
OSWatcher Black Box Analyzer Written by Oracle Center of Expertise
Copyright (c) 2012 by Oracle Corporation
Parsing Data. Please Wait...
| OSWatcher(包括:[视频]) (文档 ID 1526578.1) |
|
|
文档内容
| 用途 |
| 适用范围 |
| 详细信息 |
| OSWatcher 简介 |
| OSWatcher 下载 |
| OSWatcher 用户手册 |
| 版本:最新版本 7.3.2 2014年9月17日 |
| Version 7.0 新特性教学视频:: |
| 新增:OSWatcher 教学视频系列 |
| 新增:OSWatcher Analyzer 教学视频系列 |
| 相关链接 |
| 反馈/支持 |
| 最佳实践 |
| 如何主动避免问题发生及做好诊断信息的收集 |
| 提出问题、获取帮助并分享您对本文章的感受 |
| 参考 |
适用于:
Oracle Database - Enterprise Edition - 版本 6.0.0.0 和更高版本Oracle Database - Personal Edition - 版本 7.1.4.0 和更高版本
Oracle Database - Standard Edition - 版本 7.0.16.0 和更高版本
本文档所含信息适用于所有平台
经证明,OSWatcher Black Box 可在 AIX、Solaris、HP-UX 和 Linux 上运行。
对于 Windows,推荐使用 Cluster Health Monitor。请参阅 Document 736752.1 了解更多信息。
用途
本文档旨在为 OSWatcher 收集的数据提供一个参考,同时介绍如何安装、运行和使用 OSWatcher 。
适用范围
目标受众:所有数据库管理员。
详细信息
OSWatcher 简介
OSWatcher (oswbb) 是一个可供用户下载的工具,可以用来抓取操作系统的性能指标。
作为性能诊断数据搜集最佳实践的一部分,安装和运行 oswbb 可以帮助 Oracle 技术支持和开发更快解决您的SR。
oswbb 由两个部分组成:
1. oswbb: 一个 unix 操作系统的 shell script,来搜集和存储数据。
2. oswbba: 一个 java 工具来自动分析数据,提供建议,并且生成一个包含图形的 html 文档。
这些组件都包含在一个可供下载的 tar 文件中。
OSWatcher 下载
点击以下链接来下载 OSWatcher
OSWatcher 用户手册
以下每个文档都包含一个用户手册,来介绍产品特性及安装使用说明。可以通过以下链接访问用户手册:
这个工具将会和 Exadata 中包含的 OSWatcher 版本区分开来。
注意:如果点击下载链接之后没有下载窗口弹出,您可能需要清理您的 web 浏览器的缓存,并且/或者重启您的 web 浏览器。
版本:最新版本 7.3.2 2014年9月17日
我们强烈建议所有的用户都升级到7.1版本,因为之前的版本上有一个 bug 会造成收集快照间隔随时间增长。
Release (7.3.2)解决了一个无害的bug..
Version 7.0 新特性教学视频::
What is new in Release 7.0 (1:27) Trouble Seeing this video? Click here to download
How to run oswbba analysis on very specific time window (4:05) Trouble Seeing this video? Click here to download
Walkthrough of Release 7.0 Analysis Report (8:29) Trouble Seeing this video? Click here to download
Release (7.3.1) 解决了oswifconfig目录内的文件不能自动删除的问题. Analyzer解决了一个只有3个设备被列出在iostat的结果里的问题..
Release (7.3)包含了一个解决HP-UX上运行ifconfig相关的bug fix. Analyzer被进一步优化了,减少了分析使用的时间.
Release (7.2)包含了一些bug的fix以及功能增强.新增加了一个oswifconfig的子目录,这个目录包含了使用ifconfig检查网络接口的状态的结果.这在分析RAC相关的问题时尤其有用. 对Analyzer分析IO子系统做了一些增强,尤其是吞吐量. 在分析IO问题或者存储问题时,吞吐量是很有用的. 新版本加入了一些分析IO吞吐量及IO wait的CPU的图.
Release (7.1.3) 修复了一个分析iostat时出现的bug (只影响AIX).
Release (7.1.2) 包含了一个只影响 Solaris 用户的修复,用 prstat 替换 top 命令。
Release (7.1) 包含了一系列的补丁修复及功能增强。它修复了一个会造成收集快照间隔随时间增长的 bug。我们强烈建议所有的用户都升级到这个版本。它还包括一些功能增强,比如在分析时可以选择将 archive 中某些特定文件夹排除掉。
Release (7.0.3) 修复了一个 bug,当分析归档数据的子集而使用 -START / -STOP 参数时,需要追加一个-s 参数。/docs/The_Analyzer/oswbba_README.txt 包含了一个使用此语法的例子
Release (7.0.2) 修复了一个用 oswbba 分析早期版本 6 的 ps 输出文件时产生的 bug。
Release (7.0.1) 修复了一个 AIX 分析 top 输出的 bug。
Release (7.0) 可以分析比之前的版本更多的性能指标。可以按照进程分析内存使用,并且增加了按照指定时间窗来分析部分归档数据的功能。
并且,即将在这个版本追加一个功能,使得 Oracle Support 能够自动分析你上传到 SR上 的 oswbb,数据甚至可以在 SR 被分配到一个工程师之前就自动完成分析。
之前的 release (6.0.1) 修复了处理 extras.txt 中空行的问题,和 oswbba的损坏 profile 选项
之前的 release (6.0) 让用户可以自定义需要收集的信息,然后 oswbb 可以定时收集和管理这些信息。这个功能对于收集类似于 PeopleSoft 之类应用程序的信息非常有用。oswbb 提供了 API 扩展接口从而使之可以运行额外的 shell 脚本。同时引入的特性还有在启动时可以指定生成数据(archive)存放的路径,这个路径可以是任何的文件夹或设备。 oswbb analyzer 现在指定可以分析生成数据的某一部分。
版本 (5.2.0.1) 修复了在 AIX 中解释 iostat 输出的一个 bug。
版本 (5.2.0) 修复了一系列 bug,包括 vmstat 的输出间歇性损坏,OSWbba 对内存状态为 unknown 的解释以及其它格式的修复。
版本 (5.1.1) 中的新增功能是允许 Analyzer 拒绝压缩的文件。在以前的版本中,Analyzer 如果在归档中发现压缩的文件就会中止运行。如果需要对归档进行压缩,则应在压缩前对归档运行 Analyzer。
版本 (5.1.0) 中的新增功能是添加了仅适用于 Linux 的附加 nfs 集合,以及适用于 netstat analyzer.network Analyzer 的 bug 修正程序。归档目录现在可以驻留在所有磁盘上。此嵌入式 Analyzer 用于分析 OSWbb 收集的数据,以提供有关系统速度降低、挂起和其他 OS 性能问题的信息。请参阅 Document 461053.1 中包含的“OSWatcher Black Box Analyzer User Guide and Analyzer Overview PDF”部分内容
新增:OSWatcher 教学视频系列
oswbb Directory Tree (03:20) Trouble Seeing this video? Click here to download
How to install oswbb (03:00) Trouble Seeing this video? Click here to download
How to install oswbb on RAC (03:50) Trouble Seeing this video? Click here to download
How to configure oswbb (01:17) Trouble Seeing this video? Click here to download
How to create plugins to add your own custom data collection to oswbb (08:00) Trouble Seeing this video? Click here to download
How to configure your archive directory to any location on startup (04:48) Trouble Seeing this video? Click here to download
How to start oswbb (06:36) Trouble Seeing this video? Click here to download
How to stop oswbb (02:53) Trouble Seeing this video? Click here to download
一个名为: "Performance Analysis Using OS Watcher" 的视频 这里 介绍了如何使用OSWatcher分析 OS 性能问题
新增:OSWatcher Analyzer 教学视频系列
OSWatcher Black Box Analyzer Overview (23:00) Trouble Seeing this video? Click here to download
How to resolve error no java found (03:36) Trouble Seeing this video? Click here to download
How to resolve java out of memory error (03:50) Trouble Seeing this video? Click here to download
How to run oswbba using menu interface (11:20) Trouble Seeing this video? Click here to download
How to run oswbba analysis on very specific time window (4:05) Trouble Seeing this video? Click here to download
How to run the analyzer on only some files in the archive (02:41) Trouble Seeing this video? Click here to download
How to run oswbba on windows platform (04:00) Trouble Seeing this video? Click here to download
How to generate graphs using oswbba (06:38) Trouble Seeing this video? Click here to download
How to generate system html profile using oswbba (04:10) Trouble Seeing this video? Click here to download
How to generate an analysis report using oswbba (01:37) Trouble Seeing this video? Click here to download
Walkthrough of Release 7.0 Analysis Report (8:29) Trouble Seeing this video? Click here to download
相关链接
OSWatcher 现在是可扩展的。你可以增加客户自定义数据搜集到 oswbb 中。查看如何收集类似于 PeopleSoft 之类应用程序的信息可以使用这个文档:
反馈/支持
如果您当前正在使用 Exadata 提供的 OSW 版本,请让您的支持分析人员向开发团队提交一个 bug。
如果您当前正在使用单机版(可在此处下载),在运行 OSWatcher 时遇到未在“User Guide(用户指南)”的“Known Issue(已知问题)”中列出的问题,或者希望提供与 OSWatcher 有关的评论/反馈(包括增强功能的要求),请在我们的社区发帖。
另外,如果您购买了Oracle Linux的Long Term Support,请您开一个 Service Request.
最佳实践
如何主动避免问题发生及做好诊断信息的收集
有些问题是无法预见的,但大部分其它的问题如果及早发现一些征兆其实是可以避免的。同时,如果问题确实发生了,那么收集问题发生时的信息就非常重 要。 OSWatcher 就是一种 support 推荐的收集诊断信息的工具。有关于如何主动避免问题及诊断信息的收集,请参见:
Document 1477599.1 Best Practices Around Data Collection For Performance Issues
提出问题、获取帮助并分享您对本文章的感受
您愿意与其他 Oracle 客户、Oracle 员工及业内专家深入探讨本主题吗?
单击此处加入讨论,在这里您可以提出问题、获取他人的帮助,以及分享您对本文章的感受。
单击 此处 访问 My Oracle Support Community 页中的“Database Tuning(数据库优化)”部分,查看有关其他文章的讨论和对您有帮助的主题。
参考
NOTE:736752.1 - Introducing Cluster Health Monitor (IPD/OS)NOTE:461053.1 - OSWatcher Analyzer User Guide
|
|
|
|
& |
|
|
||||||||||||||||||||||||||||||||||||||||||||||||||||||||||||||||||||||||||||||||||||||||
|
|
||||||||||||||||||||||||||||||||||||||||||||||||||||||||||||||||||||||||||||||||
|
|
|
|
|
|||||||||||||||||||||||||||||||||||||||||||||||||||||||||||||||||||||||||||||||||||||||||||||||||||||||||||||||||||||||||||||||||||||||
|
|||||||||||||||||||||||||||||||||||||||||||||||||||||||||||||||||||||||||||||||||||||||||||||||||||||||||||||||||||||||||||||||||||||||||||||||||||||||||||||||||||||||||||||||||||||||||||
|
|
||||||||||||||||||||||||||||||||||||||||||||||||||||||||||||||||||||||||||||||||||||||||||||||||||||||||||||||||||||||||||||||||||||