Abstract: Learn how to deploy Grafana to access Zabbix
This article shows you how to deploy Grafana on Alibaba Cloud ECS to access Zabbix. Zabbix is an open-source monitoring software for networks and applications while Grafana is an open-source, full-featured dashboard and graph editor for Graphite, InfluxDB, and OpenTSDB. In this tutorial, we will be running CentOS 7.2 on an Alibaba Cloud ECS instance. We will also be using Nginx version 1.9.15 as our web server. Without further ado, let’s look at how we can implement this on our ECS instance.
1. Purchase ECS:
You should have an ECS instance with CentOS 7.2. Other configurations, such as region, do not matter much for our purposes.
2. Install Nginx
Install dependency packages for Nginx on your ECS instance.
yum -y install gcc gcc-c++ autoconf automake zlib zlib-devel o
penssl openssl-devel pcre* make gd-devel libjpeg-devel libpng-
devel libxml2-devel bzip2-devel libcurl-devel
Create an Nginx user after installing the dependency packages:
useradd nginx -s /sbin/nologin -M
Download Nginx software package and enter the directory:
wget http://nginx.org/download/nginx-1.9.15.tar.gz && tar xvf
nginx-1.9.15.tar.gz && cd nginx-1.9.15
Compile:
./configure --prefix=/usr/local/product/nginx1.9.14 --user=ngi
nx --group=nginx --with-http_ssl_module --with-http_v2_module
--with-http_stub_status_module --with-pcre
make && make install
ln -s /usr/local/product/nginx1.9.14 /usr/local/nginx    ==>cr
eate soft link
The list below describes the arguments we used when compiling the code:
--with-http_stub_status_module: This argument enables Nginx state query--with-http_ssl_module: This arguments enables https support--with-http_spdy_module: This argument provides support for SPDY, which in turn must be supported by ssl (You can find more information about SPDY online)--with-pcre: prce must be configured in order to support the rewrite function
3. Install Grafana
After successfully installing Nginx, we need to install Grafana.
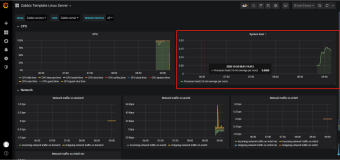
Grafana’s amazing visualization capabilities, combined with Zabbix’s powerful monitoring tools, greatly simplifies network management.
Grafana provides a plug-in for Zabbix, making the combination of these two software extremely convenient. To install Grafana, input the following commands.
mkdir /opt/grafana && cd /opt/grafana
wget https://s3-us-west-2.amazonaws.com/grafana-releases/release/grafana-4.3.2.linux-x64.tar.gz
tar -zxvf grafana-4.3.2.linux-x64.tar.gz
mv grafana-4.3.2 grafana
cd grafana/bin/
# View installable plug-ins
./grafana-cli plugins list-remote
# Install zabbix plug-in
./grafana-cli plugins install alexanderzobnin-zabbix-app
# Install pie chart plug-in
./grafana-cli plugins install grafana-piechart-panel
# Launch, and run in background
./grafana-server -homepath /opt/grafana/grafana &
4. Manage Website Configuration (Nginx) with Grafana
Now that we have Grafana installed, we can edit Nginx web hosting as follows:
[root@grafana conf]# mkdir extra
[root@grafana conf]# cd extra/
[root@grafana extra]# vim grafana.conf
server {
    listen       80;
    server_name  grafana.dtstack.com;
    access_log /data/logs/zabbix/grafana.dtstack.com.access.log main;
    location / {
        index  index.html;
    proxy_pass http://127.0.0.1:3000;
    proxy_set_header   Host             $host;
    proxy_set_header   X-Real-IP        $remote_addr;
    proxy_set_header   X-Forwarded-For  $proxy_add_x_forwarded_for;
    }
}
Edit the configuration file ngix.conf:
[root@grafana conf]# cat nginx.conf
user nginx;worker_processes 1;
#error_log logs/error.log warning;#error_log logs/error.log notice;#error_log logs/error.log info;
pid logs/nginx.pid;
events {
    worker_connections  1024;
}
http {
include mime.types;
default_type application/octet-stream;
log_format main '$remote_addr - $remote_user [$time_local] "$request" '
'$status $body_bytes_sent "$http_referer" '
'"$http_user_agent" "$http_x_forwarded_for"';
access_log logs/access.log main;
sendfile on;
#tcp_nopush on;
#keepalive_timeout 0;
keepalive_timeout 65;
#gzip on;
include extra/*.conf;
}Add file /etc/hosts:192.168.119.140 grafana.dtstack.com
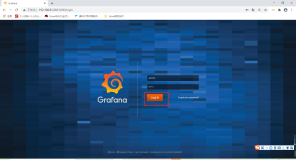
Access GrafanaAccess http://grafana.dtstack.com admin/admin
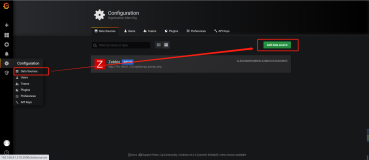
5. Add a data source.
Finally, we require a data source for the Zabbix plug-in to work correctly.
Enable zabbix plug-in
Data Source Configuration - Data Source
    Name:      zabbix
    Default:   ️
    Type:      Zabbix
## Http settings
URL: http://zabbix.dtstack.com/api_jsonrpc.php
Access: proxy ## Zabbix API details
Username: xxxxxx
Password: xxxxxxAnd there you have it! You should now be able to access Zabbix using Grafana to monitor and manage your website or application.