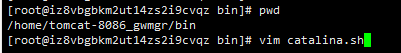
1、Tomcat 加入远程调试,在catalina.bat :
SET CATALINA_OPTS=-server -Xdebug -Xnoagent -Djava.compiler=NONE -Xrunjdwp:transport=dt_socket,server=y,suspend=n,address=5888
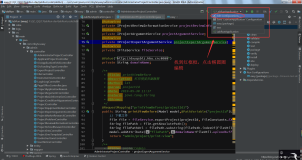
设好后,在eclipse 中调试中,新增一个远程调试,IP & Address 就写相应的,项目要选已部署在Tomcat下的项目即可。
2、加入JMS代理:
catalina.bat :
set JAVA_OPTS=%JAVA_OPTS% -Xms512m -Xmx1024m -XX:PermSize=128m -XX:MaxPermSize=256m -Dcom.sun.management.jmxremote.port=2012 -Dcom.sun.management.jmxremote.ssl=false -Dcom.sun.management.jmxremote.authenticate=false
这样就可以了visulaVM 对Tomcat作监控了。
http://www.kaifajie.cn/tomcat6/6216.html
Eclipse用的是3.2.2,Jboss是4.2.2
1.设定Jboss的启动参数,把Debug端口放开
打开[/jboss-4.2.2.GA/bin/run.conf]文件,把47行的注释放开,如下所示
# Sample JPDA settings for remote socket debuging
JAVA_OPTS="$JAVA_OPTS -Xrunjdwp:transport=dt_socket,address=8787,server=y,suspend=n"
2.利用Eclipse进行Debug
首先在Eclipse中一定要有被调试应用的工程,然后打开Eclipse的Debug模式,选择好对应的工程、远程Server的IP,以及端口(8787),
直接运行就可以了。当然要确保服务已启动。
http://www.eclipsezone.com/eclipse/forums/t53459.html
How many times trying to fix a server-side Java problem appeared trivial, but getting to the source of the problem took all the time? A remote debugger attached to a Java application can shorten the defect-discovery times significantly and make the process more enjoyable.
<!-- What is it -->
The Java Debugger
The Java Debugger (jdb) is a dynamic, controlled, assignment-based debugging tool. It helps find and fix bugs in the Java language programs both locally and on the server. To use jdb in a J2EE application server you must first launch it with debugging enabled and attach to the server from the debugger through a JPDA port (Default port is 1044).
The default JPDA options for J2EE servers are as follows:
-Xdebug -Xrunjdwp:transport=dt_socket,server=y,suspend=n,address=1044
The jdb parameters specify the way debugger will operate. For instancetransport=dt_socket instructs the JVM that the debugger connections will be made through a socket while the address=1044 parameter informs it that the port number will be 1044. Similarly, if you substitute suspend=y , the JVM starts in suspended mode and stays suspended until a debugger is attached to it. This may be helpful if you want to start debugging as soon as the JVM starts.
Debugging WebLogic
Debugging WebLogic is no different than debugging any other Java remote application. You need to make sure to launch it with the required debugging arguments and attach a debugger. In the case of WebLogic 8.1, you need to add these arguments to the startup script. WebLogic comes with several launch scripts (*.sh and *.cmd) under BEA_HOME/weblogic81/server/bin.
- Locate startWSL.cmd and add the following variable DEBUG_OPTS:
set DEBUG_OPTS = -Xdebug -Xrunjdwp:transport= dt_socket,address=1044,server=y,suspend=n
- Next, insert the new variable to the WebLogic startup command, after "%JAVA_HOME%\bin\java" and preferably before the other options.
- Your startup script should look like:
"%JAVA_HOME%\bin\java" %DEBUG_OPTS% %JAVA_VM% %MEM_ARGS% %JAVA_OPTIONS%-Dweblogic.Name=%SERVER_NAME% -Dweblogic.management.username= %WLS_USER%-Dweblogic.management.password= %WLS_PW% -Dweblogic.management.server= %ADMIN_URL%-Dweblogic.ProductionModeEnabled= %PRODUCTION_MODE%-Djava.security.policy= "%WL_HOME%\server\lib\weblogic.policy" weblogic.Server
Debugging JBoss
Same as WebLogic, except that you need to change run.bat/run.sh located under JBOSS_HOME/bin.
Linux users should see something similar to this:
 $ cd /var/jboss4/bin
 $ sh ./run.sh
 =========================================================================

 JBoss Bootstrap Environment

 JBOSS_HOME: /var/jboss4

 JAVA: /usr/java/j2sdk1.4.2_06/bin/java

 JAVA_OPTS: -server -Xms128m -Xmx128m -Dprogram.name=run.sh

 DEBUG_OPTS = -Xdebug -Xrunjdwp:transport= dt_socket,address=1044,server=y,suspend=n

 CLASSPATH: /var/jboss4/bin/run.jar:/usr/java/j2sdk1.4.2_06/lib/tools.jar

 =========================================================================
Debugging Tomcat
Again, very much similar to WebLogic and JBoss, except that you need to change catalina.bat/catalina.sh located under TOMCAT_HOME/bin.
Debugger Verification
Now you can launch your application in debug mode. Just to make sure that the server is listening to port 1044 you can run netstat /a. You should see port 1044 in the list of open ports (See Figure 1: List of open ports: netstat -a).
Figure 1 List of open ports: netstat -a
The Eclipse Connection
After making sure WebLogic is listening for incoming connections on port 1044, what is left is to tell Eclipse to connect to this port and you are ready to debug.
-
- In Eclipse, navigate to Run | Debug (See Figure 2: Create new Remote Java Application configuration in Eclipse ).
- Select Remote Java Application , on the left column. Click New , on the bottom of the same column.
- In the Create configuration screen you'll be prompted to enter some values. Start with a meaningful name. In my case that's WebLogic Instance . For Project, select the Java project that contains the source code you want to debug. Leave Connection Type in default, i.e. Standard (Socket Attach) . For Host , enter localhost. If you want to debug a remote server, enter its hostname or IP address. For port, enter 1044 or the port you defined in your WebLogic startup script.
- Click Apply
- Make sure WebLogic instance is running in debug mode. In the same screen click Debug . Eclipse should automatically take you to the Debug perspective and you should see a stack trace in the Debug view.
- If you are not automatically taken to the Debug perspective, select Window | Open Perspective | Other and then click Debug.
Figure 2 Create new Remote Java Application configuration in Eclipse
Figure 3 Breakpoint hit in Eclipse debugger
Eclipse Debug window should automatically pop-up with the stack pointer on your first breakpoint (See Figure 3: Breakpoint hit in Eclipse's debugger ). After that, you can use all the various functions that the debugger has to offer, namely variable assignments, step-into, drop to frame, etc.
References
- Debugging J2EE Applications
- Connecting to a Remote VM with the Java Remote Application Launcher
- Debugging with the Eclipse Platform
System Information
- Windows 2000
- JDK 1.4.2_03
- Eclipse 3.0
- BEA WebLogic 8.1
- JBoss 4.0.2
- Tomcat 5.0.26
For Tomcat (5.5 here, don't know about other versions) you don't need to edit catalina.sh, just start it with:
$ ./bin/catalina.sh jpda start
and it will use dt_socket on port 8000.
I like the fact that you can debug an Eclipse workbench remotely:
> Listing 1. Launching a remotely debuggable workbench
>eclipse.exe -vmargs -Xdebug -Xnoagent \
>-Xrunjdwp:transport=dt_socket,address=8000,server=y,suspend=n
Not all JREs support hot-swap bytecode; JRockit is one of them. In short; you can't do it if you're using JRockit. (In Eclipse 3.3, if you right-click on a remote application, then you can see what services the remote VM provides.)
http://www.eclipsezone.com/eclipse/forums/t53459.html