
Background
Heart disease is a major cause of death, affecting over one-third of the world's population. In China, hundreds of thousands of people die of heart disease every year. If we can predict and diagnose heart disease in patients, we can reduce the number of deaths cause by heart diseases.
A promising method of screening heart diseases is through data mining. By extracting common physical examination indicators, we can build a reliable prediction model for each patient. This article illustrates how to build a heart disease prediction case through the Alibaba Cloud machine learning platform using real data.
Heart Disease Data Set
Data Source: UCI open-source Heart Disease Data Set
The data set below contains the physical examination data of heart disease patients in an area in the United States, with 303 instances in total. The specific fields are as follows:
| Field | Meaning | Type | Description |
| age | Age | string | Age of the subject, in number. |
| age | Age | string | Age of the subject, in number. |
| cp | Chest pain types | string | The pain severity from high to low is: typical, atypical, non-anginal and asymptomatic. |
| trestbps | Blood pressure | string | Blood pressure value. |
| chol | Cholesterol | string | Cholesterol level. |
| fbs | Fasting blood sugar (FBS) | string | If FBS > 120 mg/dl, true, otherwise false. |
| restecg | Electrocardiographic results | string | Whether T wave exists. From mild to severe: norm, hyp. |
| thalach | Maximum heart rate | string | Maximum heart rate. |
| exang | Exercise induced angina | string | If the patient has angina, true; otherwise false. |
| oldpeak | ST depression induced by exercise relative to rest | string | Pressure of the ST segment. |
| slop | The slope of the peak exercise ST segment | string | The slope of the ST segment. Different degrees of down, flat or up. |
| ca | Number of major vessels colored by fluoroscopy | string | Number of major vessels colored by fluoroscopy. |
| thal | Defect categories | string | Categories of complications. From mild to severe: norm, fix, and rev. |
| status | Whether diseased | string | Whether diseased. Buff indicates healthy, and sick indicates diseased. |
Data Exploration Procedure
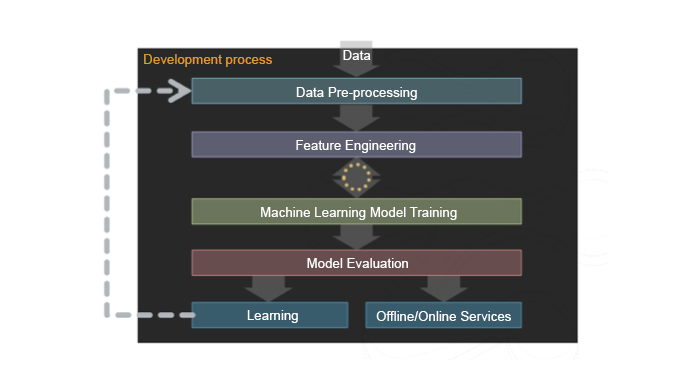
The following diagram illustrates the data mining process.
Image 1:
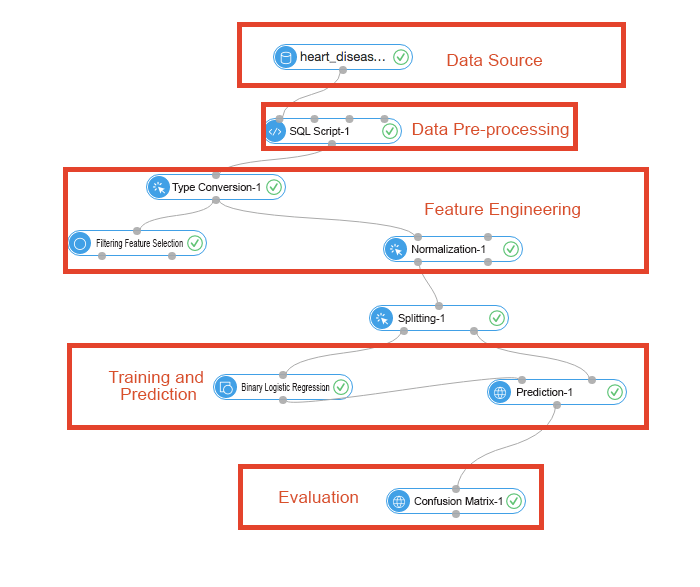
The diagram below illustrates the specific steps required to deploy the data mining process.
Image 2:
Data Pre-processing
Data pre-processing, also called data cleansing, removes data anomalies through data de-noising, missing value insertion, and type conversion operations before the data is used in an algorithm. The input data for this experiment consists of 14 features and a target queue. In this algorithm, the possibility of a user suffering from a heart disease is predicted based on the user's physical indicators. Because this classification experiment adopts linear logistic regression, all input values are binary.
The table below represents the input data.
Image 3:
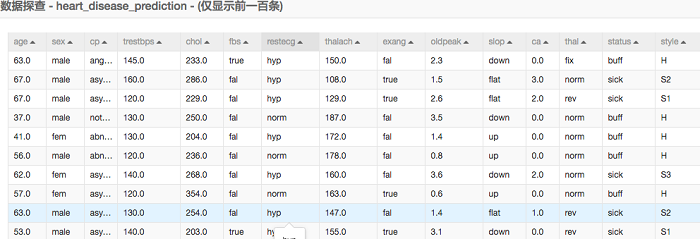
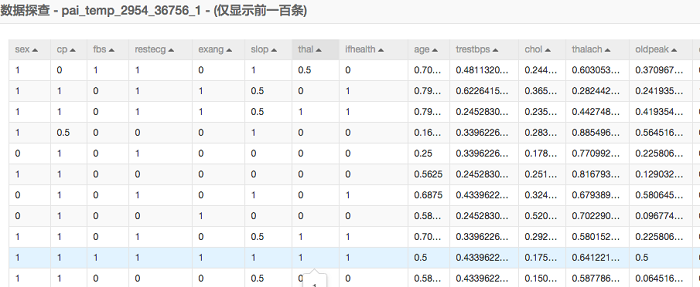
We can see that a most data are text descriptions. In the data pre-processing process, we need to map the character string into specific values.
- Binary data: A majority of recorded data in this example is binary. Binary data is easier to convert and analyze. For example, the fbs field has two values: false and true. We can express false as 0 and true as 1.
- Multi-valued data: Data such as the cp field, uses multiple values to indicate the pain severity. We can map the severity from low to high with numerical values of 0 to 3.
SQL scripts implement the data pre-processing. For details, refer to SQL script-1 component.
select age,
(case sex when 'male' then 1 else 0 end) as sex,
(case cp when 'angina' then 0  when 'notang' then 1 else 2 end) as cp,
trestbps,
chol,
(case fbs when 'true' then 1 else 0 end) as fbs,
(case restecg when 'norm' then 0 when 'abn' then 1 else 2 end) as restecg,
thalach,
(case exang when 'true' then 1 else 0 end) as exang,
oldpeak,
(case slop when 'up' then 0 when 'flat' then 1 else 2 end) as slop,
ca,
(case thal when 'norm' then 0 when 'fix' then 1 else 2 end) as thal,
(case status when 'sick' then 1 else 0 end) as ifHealth
from ${t1};
Feature Engineering
Feature engineering includes feature derivation and scale variation. In this example, there are two components responsible for feature engineering: filtering feature selection and normalization.
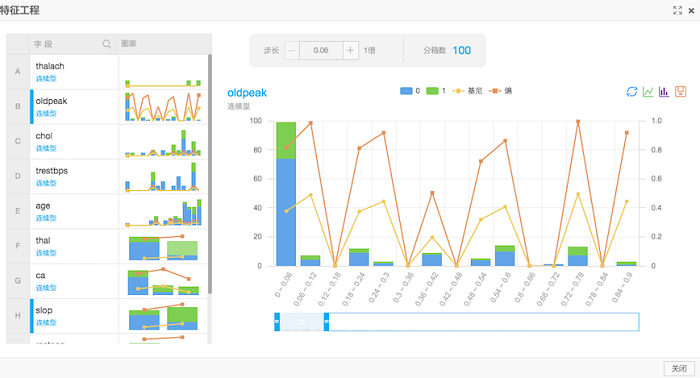
- Filtering feature selection: This element is used to determine the impact of each feature on the results and is expressed with comentropy and Gini coefficient. You can view the evaluation report to check the final results.
Image 4:
- Normalization: Since this experiment uses binary logistic regression for model training, the value of each feature should be normalized to between 0 and 1. The normalization formula is: result = (val-min)/(max-min). The table below represents the normalization results.
Image 5:
Model Training and Prediction
We can train our prediction model by analyzing existing data because we already know whether each patient has heart disease. This process is also known as supervision and learning. The trained model is then used to predict if users suffer from heart disease. The training and prediction process is described as follows:
- Splitting: First, data is divided into two parts using component splitting. In this experiment, data is split based on a ratio of 7:3 for the training set and the prediction set. The training set data is used in the binary logistic regression component for model training, while the prediction set data is used in the prediction component.
- Binary Logistic Regression: Logistic regression is a linear model where classification is achieved by calculating the threshold of the result. You can learn more about the specific algorithms online or from books. You can view the trained model after logistic regression in the model tab.
Image 6:
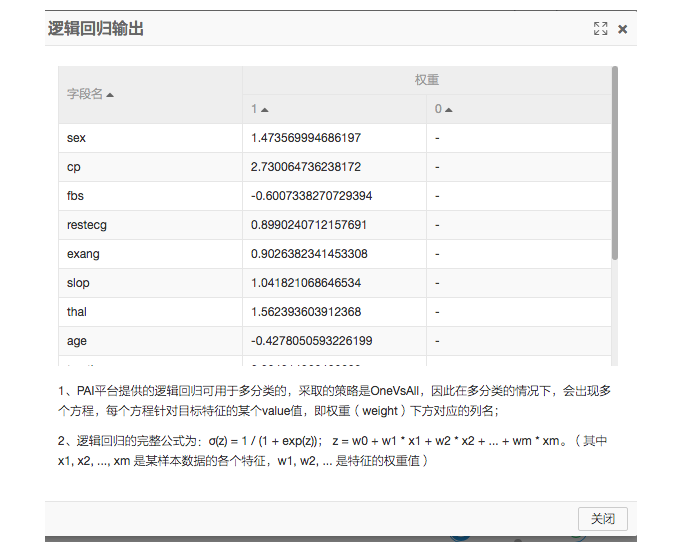
- Prediction: The two inputs of the prediction component are the model and the prediction set. The prediction result shows the predicted data, actual data, and the probability of different results in each group.
- Evaluation: The confusion matrix, also known as the error matrix, is used to evaluate the accuracy of the model.
Image 7:

Feature Weight
The prediction model can be further fine-tuned using feature engineering. We can adjust the weight of each feature to produce more accurate results. In our observations:
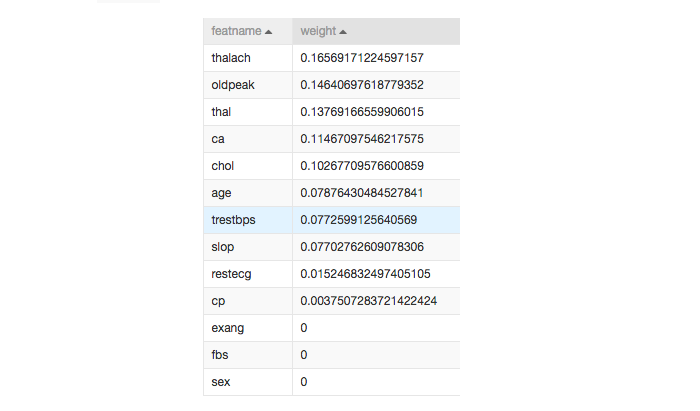
- The maximum heart rate achieved (thalach) value has the highest correlation to the possibility of heart disease.
- The gender of the patient has a low correlation with the development of heart disease.
The image below shows the adjusted weights in our model based on feature engineering. A higher weight value indicates a stronger correlation to the outcome.
Image 8:
Summary and Prediction Results
By using the weighted features provided above, we can achieve a heart disease prediction accuracy of greater than 80 percent. With further research, this model can be used to assist physicians in the prevention and treatment of heart disease.
With the prevalence of heart disease in the modern society, predicting such a disease would not only be a pioneering breakthrough but also be opening the floodgates to a variety of applications in predictive medicine.


