前言
很多web应用会选择ELK来做日志采集系统,这里选用Flume,一方面是因为熟悉整个Hadoop框架,另一方面,Flume也有很多的优点。
关于Apache Hadoop Ecosystem 请点击这里。
Cloudera 官方的教程也是基于这个例子开始的,get-started-with-hadoop-tutorial
并且假设我们已经了解Flume(agent, Source, Channel, Sink) , Morphline (ETL), Solr (全文检索),如果都没有了解,请自行百度。
Scenario (需求)
首先我们有多个web 应用,每个web应用每天都有不断的日志产生,这些日志文件现在以文件的形式存储在服务器当中,我们需要收集这些日志,并对日志进行查询。
所以整个流程就是,Flume agent 收集日志 -> Morphline 进行过滤 -> 对结果进行索引然后在Solr中进行搜索。
Flume 收集日志
    1、使用 Spooling Directory Source
         就是监视指定目录是否有新文件移入,如果有,就会读取这些Event, 但是文件一旦被移到该目录之后,就不应该被写入,目录               下的文件名也不可重复,这样的情况就是需要定期将文件移动到指定的目录,不能实现实时的读取。

    2、使用 Exec Source
         就是通过下面的命令行产生的结果作为源,在agent 死亡或或者机器重启的过程可能会存在数据丢失
agent.sources.execSrc.type = exec
agent.sources.execSrc.shell=/bin/bash -c
agent.sources.execSrc.command= tail -F /var/log/flume/flume.log | grep "error: " 1、使用消息中间件JMS或者KAFKA
请参考: 基于Flume+Log4j+Kafka的日志采集架构方案
客户端直接发送至kafaka queue , 用 log4j KafkaAppender
2、使用Flume Appender
对于Java web 应用,我们就最简单直接采取这种方式。 Flume Appender 我们这里就直接采用log4j2 , 关于日志框架的这些说 明,请看另一片博客 spring boot use log4j log4j 关于flume Appender 的配置
The Flume Appender supports three modes of operation.
    1、It can act as a remote Flume client which sends Flume events via Avro to a Flume Agent configured with an Avro Source.(同                 步,Avro协议)

     2、It can act as an embedded Flume Agent where Flume events pass directly into Flume for processing.(异步,需要维护客户端                  flume)

      3、It can persist events to a local BerkeleyDB data store and then asynchronously send the events to Flume, similar to the    embedded Flume Agent but without most of the Flume dependencies.(先写数据库,再异步发送)
Usage as an embedded agent will cause the messages to be directly passed to the Flume Channel and then control will be immediately returned to the application. All interaction with remote agents will occur asynchronously. Setting the "type" attribute to "Embedded" will force the use of the embedded agent. In addition, configuring agent properties in the appender configuration will also cause the embedded agent to be used.
我们下面就简单的用第一种方式
客户端配置
log4j.xml
<?xml version="1.0" encoding="UTF-8"?>
<Configuration status="warn" name="MyApp" packages="">
  <Appenders>
    <Flume name="eventLogger" compress="true">
      <Agent host="192.168.10.101" port="8800"/>
      <Agent host="192.168.10.102" port="8800"/>
      <RFC5424Layout enterpriseNumber="18060" includeMDC="true" appName="MyApp"/>
    </Flume>
  </Appenders>
  <Loggers>
    <Root level="error">
      <AppenderRef ref="eventLogger"/>
    </Root>
  </Loggers>
</Configuration>
服务端配置
参考:flume log4j appender config
下载 flume, 在conf 目录下,配置example.conf :
# example.conf: A single-node Flume configuration

# Name the components on this agent
a1.sources = r1
a1.sinks = k1
a1.channels = c1

# Describe/configure the source
a1.sources.r1.type = org.apache.flume.clients.log4jappender.Log4jAppender
a1.sources.r1.bind = localhost
a1.sources.r1.port = 44444

# Describe the sink
a1.sinks.k1.type = logger

# Use a channel which buffers events in memory
a1.channels.c1.type = memory
a1.channels.c1.capacity = 1000
a1.channels.c1.transactionCapacity = 100

# Bind the source and sink to the channel
a1.sources.r1.channels = c1
a1.sinks.k1.channel = c1
启动 flume
bin/flume-ng agent --conf conf --conf-file example.conf --name a1 -Dflume.root.logger=INFO,console查看日志,是否成功。
Solr 配置
关于solr的介绍
这里 solr的数据也是需要存储到 hdfs中的,另外solr 是通过zookeeper 来管理的
以下配置,这里用的cloudera manager 安装,所以自动配好了,但是需要检验,如果是手动安装也有对应的文档可以直接查看, 另外这里省略Solr Authentication。
配置 zookeeper service
$ cat /etc/solr/conf/solr-env.sh
export SOLR_ZK_ENSEMBLE=zk01.example.com:2181,zk02.example.com:2181,zk03.example.com:2181/solr
配置 solr use hdfs
$ cat /etc/default/solr
//地址nn01.example.com:8020 是hdfs name node的地址
SOLR_HDFS_HOME=hdfs://nn01.example.com:8020/solr

//To create the /solr directory in HDFS,需要创建/solr hdfs目录:
$ sudo -u hdfs hdfs dfs -mkdir /solr
$ sudo -u hdfs hdfs dfs -chown solr /solr
initializing the ZooKeeper Namespace
$ sudo service solr-server restart启动solr
$ sudo service solr-server restartsolr collection 配置
solr 通过 collection 来组织逻辑数据,所以你需要创建collection,每个collection有自己的配置,文档上已经讲的比较清楚了,而且也不多,这里不再赘述
Generating Collection Configuration
下面是的collection是用来存储上面收集到的日志:
// 使用默认模版创建instancedir
$ solrctl instancedir --generate $HOME/weblogs_config

// upload instancedir to zookeeper,上传配置
$ solrctl instancedir --create weblogs_config $HOME/weblogs_config

//verify instance
$ solrctl instancedir --list

// create collection  -s shard_count, collection 和config 关联
$ solrctl collection --create weblogs_collection -s 2 -c weblogs_config
A SolrCloud collection is the top-level object for indexing documents and providing a query interface. Each collection must be associated with an instance directory. Different collections can use the same instance directory. Each collection is typically replicated among several SolrCloud instances. Each replica is called a core and is assigned to an individual Solr service. The assignment process is managed automatically, although you can apply fine-grained control over each individual core using the solrctl core command . 这是 collection 和instance之间关系的介绍
成功创建之后如何修改和扩展,请参考这里solectl usage
Morphline (ETL)
创建好 collection 之后,我们就需要将日志解析存储到solr里,方便检索。Morphline 就是这个中间过程的ETL工具(extracting, transforming and loading data), Flume 提供了Morphlion Solr Sink, 从 log flume的source中读取event,经过ETL导入到solr中。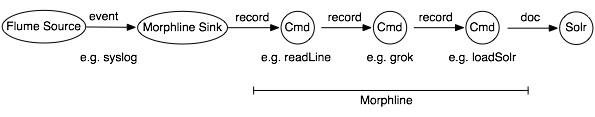
配置flume
继续上面的flume,中 example.conf 的配置
a1.sources = r1
a1.sinks = k1
a1.channels = c1

# Describe/configure the source
a1.sources.r1.type = avro
a1.sources.r1.bind = 0.0.0.0
a1.sources.r1.port = 4444

# Describe the sink
a1.sinks.k1.type = org.apache.flume.sink.solr.morphline.MorphlineSolrSink
a1.sinks.k1.morphlineFile=morphlines.conf
a1.sinks.k1.morphlineId = morphline_log4j2

# Use a channel which buffers events in memory
a1.channels.c1.type = memory
a1.channels.c1.capacity = 1000
a1.channels.c1.transactionCapacity = 1000

# Bind the source and sink to the channel
a1.sources.r1.channels = c1
a1.sinks.k1.channel = c1
配置Morphline
我们的日志格式文件如下:
[INFO ] 2017-07-14 11:40:51.556 [main] RequestMappingHandlerAdapter - Detected ResponseBodyAdvice bean in apiResponseAdvice需要解析成:
level: INFO
create_time: 2017-07-14 11:40:51.556
thread: main
class:  RequestMappingHandlerAdapter
 -    //这里有个短横线
message: Detected ResponseBodyAdvice bean in apiResponseAdvice
所以我们使用grok
在线调试工具online tools
 # grok get data from unstructured line
     {
        grok {
          dictionaryFiles : [grok-dictionary.conf]
          expressions : {
            message : """\[%{LOGLEVEL:level} \] %{SC_LOGDATETIME:create_time} \[%{DATA:thread}\] %{WORD:class} [-] %{GREEDYDATA:message}"""
          }
        }

      }

      # Consume the output record of the previous command and pipe another
      # record downstream.
      #
      # convert timestamp field to native Solr timestamp format
      # e.g.  2017-07-14 11:40:52.512 to 2012-09-06T07:14:34.000Z
      {
        convertTimestamp {
          field : create_time
          inputFormats : ["yyyy-MM-dd HH:mm:ss.SSS", "yyyy-MM-dd"]
          inputTimezone : America/Los_Angeles
          outputFormat : "yyyy-MM-dd'T'HH:mm:ss.SSS'Z'"
          outputTimezone : UTC
        }
      }
配置 schema.xml
在上一节,配置solr的时候,我们生成了默认的模版,我们需要根据实际的需求修改schema.xml,在$HOME/weblogs/conf 下
The schema.xml file contains all of the details about which fields your documents can contain, and how those fields should be dealt with when adding documents to the index, or when querying those fields.
schema.xml
solrconfig.xml
   <field name="level" type="text_general" indexed="true" stored="true" multiValued="true"/>
   <field name="create_time" type="date" indexed="true" stored="true"/>
   <field name="thread" type="text_general" indexed="true" stored="true"/>
   <field name="class" type="text_general" indexed="true" stored="true"/>
   <field name="message" type="text_general" indexed="true" stored="true"/>
重新上传配置到zookeeper
$ solrctl instancedir --update weblogs_config $HOME/weblogs_config
$ solrctl collection --reload weblogs_collection
总结
到此为止,我们完成了日志的收集,解析,索引,你可以通过 Hue来进行搜索和查询了,或者自己定义UI。这个教程比较基础也相对简单,但是可以完成基本的需求,也把日志处理流程走了一遍,剩下的大家自定义即可。
