1.jps:查看当前运行着的java进程(仿linux下的ps),显示进程号
2. jinfo: 查参数jinfo -flagPermSize 2208(进程号)
|
jinfo -flag MaxPermSize 2208(进程号)
C:\Users\WILL>jinfo
Usage:
jinfo <option> <pid>
(to connect to a running process)
where <option> is one of:
-flag <name> to print the value of the named VM flag
-flag [+|-]<name> to enable or disable the named VM flag
-flag <name>=<value> to set the named VM flag to the given value
-h | -help to print this help message
|
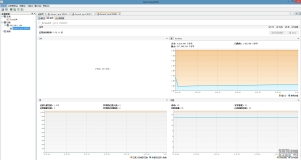
3. jconsole 2208
用法:
|
jconsole [ -interval=n ] [ -notile ] [ -pluginpath <path> ] [ -version ] [ connection ...]
-interval 将更新间隔时间设置为 n 秒(默认值为 4 秒)
-notile 最初不平铺显示窗口(对于两个或更多连接)
-pluginpath 指定 jconsole 用于查找插件的路径
-version 输出程序版本
connection = pid || host:port || JMX URL (service:jmx:<protocol>://...)
pid 目标进程的进程 ID
host 远程主机名或 IP 地址
port 用于远程连接的端口号
-J 对正在运行 jconsole 的 Java 虚拟机指定
|
输入参数
4. jstack 2208列出所有线程,以及线程的运行状态
|
C:\Users\WILL>jstack
Usage:
jstack [-l] <pid>
(to connect to running process)
Options:
-l long listing. Prints additional information about locks
-h or -help to print this help message
|
5. jstat -gcutil 2208 1000(每隔1000毫秒打印一次信息) 10(打印10行)
|
C:\Users\WILL>jstat
invalid argument count
Usage: jstat -help|-options
jstat -<option> [-t] [-h<lines>] <vmid> [<interval> [<count>]]
Definitions:
<option> An option reported by the -options option
<vmid> Virtual Machine Identifier. A vmid takes the following form:
<lvmid>[@<hostname>[:<port>]]
Where <lvmid> is the local vm identifier for the target
Java virtual machine, typically a process id; <hostname> is
the name of the host running the target Java virtual machine;
and <port> is the port number for the rmiregistry on the
target host. See the jvmstat documentation for a more complete
description of the Virtual Machine Identifier.
<lines> Number of samples between header lines.
<interval> Sampling interval. The following forms are allowed:
<n>["ms"|"s"]
Where <n> is an integer and the suffix specifies the units as
milliseconds("ms") or seconds("s"). The default units are "ms".
<count> Number of samples to take before terminating.
-J<flag> Pass <flag> directly to the runtime system.
|
C:\Users\WILL>jstat -options
-class
-compiler
-gc
-gccapacity
-gccause
-gcnew
-gcnewcapacity
-gcold
-gcoldcapacity
-gcpermcapacity
-gcutil
-printcompilation
6. jmap把虚拟机里运行着的所有文件都down下来,相当于快照
|
C:\Users\WILL>jmap
Usage:
jmap -histo <pid>
(to connect to running process and print histogram of java object heap
jmap -dump:<dump-options> <pid>
(to connect to running process and dump java heap)
dump-options:
format=b binary default
file=<file> dump heap to <file>
Example: jmap -dump:format=b,file=heap.bin <pid>
|
7. jhat 对jmap下来的文件进行分析,多个角度
|
Usage: jhat [-stack <bool>] [-refs <bool>] [-port <port>] [-baseline <file>] [-
debug <int>] [-version] [-h|-help] <file>
-J<flag> Pass <flag> directly to the runtime system. For
example, -J-mx512m to use a maximum heap size of 512MB
-stack false: Turn off tracking object allocation call stack.
-refs false: Turn off tracking of references to objects
-port <port>: Set the port for the HTTP server. Defaults to 7000
-exclude <file>: Specify a file that lists data members that should
be excluded from the reachableFrom query.
-baseline <file>: Specify a baseline object dump. Objects in
both heap dumps with the same ID and same class will
be marked as not being "new".
-debug <int>: Set debug level.
0: No debug output
1: Debug hprof file parsing
2: Debug hprof file parsing, no server
-version Report version number
-h|-help Print this help and exit
<file> The file to read
For a dump file that contains multiple heap dumps,
you may specify which dump in the file
by appending "#<number>" to the file name, i.e. "foo.hprof#3".
All boolean options default to "true"
|
图片又不能上传。。。就打印出这些帮助参数来,能看懂得了。
最新内容请见作者的GitHub页:http://qaseven.github.io/