本节书摘来自华章社区《R语言机器学习:实用案例分析》一书中的第1章,第1.5节高级结构,作者[印度] 拉格哈夫·巴利(Raghav Bali)迪潘简·撒卡尔(Dipanjan Sarkar),更多章节内容可以访问云栖社区“华章社区”公众号查看
1.5 高级结构
当我们讨论不使用循环来操作向量时,我们前面提到向量化这个术语。虽然循环是遍
历向量并进行计算的一个好方法,但是在处理现大数据时它并不是非常有效。这时,R 提
供了下面介绍的一些高级结构。我们将介绍以下函数:
J lapply :对列表进行循环,并对列表的每个元素进行函数求值。
J sapply : lapply 的简化版本。
J apply :对数组的边界进行函数求值。
J tapply :对一个向量的子集进行函数求值。
J mapply : lapply 的多元版本。
1.5.1 lapply 和 sapply 函数
正如我们之前提到的, lapply 将一个列表和一个函数作为输入,对列表中的每一个元
素进行函数求值。如果输入不是列表,它将在返回输出前应用函数 as.list 将输入参数转
换成列表类型。因为实际循环在内部使用 C 语言代码来实现,所以 lapply 比普通的循环运
行得更快。
在下面的代码片段中,我们将看到 lapply 的实现和一个案例:
Advanced constructs
We heard the term vectorized earlier when we talked about operating on vectors
without using loops. While looping is a great way to iterate through vectors and
perform computations, it is not very efficient when we deal with what is known
as Big Data. In this case, R provides some advanced constructs which we will be
looking at in this section. We will be covering the following functions:
• lapply : Loops over a list and evaluates a function on each element
• sapply : A simplified version of lapply
• apply : Evaluates a function on the boundaries or margins of an array
• tapply : Evaluates a function over subsets of a vector
• mapply : A multivariate version of lapply
lapply and sapply
Like we mentioned earlier, lapply takes a list and a function as input and evaluates
that function over each element of the list. If the input list is not a list, it is converted
into a list using the as.list function before the output is returned. It is much faster
than a normal loop because the actual looping is done internally using C code.
We look at its implementation and an example in the following code snippet:
> # lapply function definition
> lapply
function (X, FUN, ...)
{
FUN <- match.fun(FUN)
if (!is.vector(X) || is.object(X))
X <- as.list(X)
.Internal(lapply(X, FUN))
}
<bytecode: 0x00000000003e4f68>
<environment: namespace:base>
Chapter 1
> # example
> nums <- list(l1=c(1,2,3,4,5,6,7,8,9,10), l2=1000:1020)
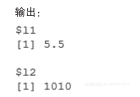
> lapply(nums, mean)
Output:
Coming to sapply , it is similar to lapply except that it tries to simplify the results
wherever possible. For example, if the final result is such that every element is of
length 1 , it returns a vector, if the length of every element in the result is the same
but more than 1, a matrix is returned, and if it is not able to simplify the results, we
get the same result as lapply . We illustrate the same with the following example:
> data <- list(l1=1:10, l2=runif(10), l3=rnorm(10,2))
> data
Output:输出:
提到 sapply ,除了它尝试尽可能地简化输出结果之外,它与 lapply 十分相似。例如,
如果最终结果的每个元素的长度都为 1,那么 sapply 将返回一个向量;如果最终结果的每
个元素的长度都相同但大于 1,那么它将返回一个矩阵;如果不能简化结果,那么我们将得
到与 lapply 一样的结果。我们用下面的例子进行说明:
> # example
> nums <- list(l1=c(1,2,3,4,5,6,7,8,9,10), l2=1000:1020)
> lapply(nums, mean)
Output:
Coming to  sapply , it is similar to  lapply except that it tries to simplify the results
wherever possible. For example, if the final result is such that every element is of
length  1 , it returns a vector, if the length of every element in the result is the same
but more than 1, a matrix is returned, and if it is not able to simplify the results, we
get the same result as  lapply . We illustrate the same with the following example:
> data <- list(l1=1:10, l2=runif(10), l3=rnorm(10,2))
> data
Output: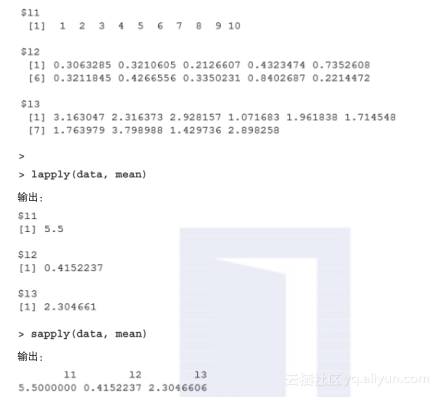
1.5.2 apply 函数
apply 函数用于对数组的边界进行函数求值。例如,对一个数组的行或列应用聚集函数
(aggregate function)。函数 rowSums 、 rowMeans 、 colSums 和 colMeans 在其内部也使用 apply
函数,但进行了进一步的优化,在处理大数组时十分有用。在下面的例子中我们将看到以
上函数的使用:
Getting Started with R and Machine Learning
[ 34  ]
Output:
> sapply(data, mean)
Output:
apply
The  apply function is used to evaluate a function over the margins or boundaries
of an array; for instance, applying aggregate functions on the rows or columns of an
array. The  rowSums ,  rowMeans ,  colSums, and  colMeans functions also use  apply
internally but are much more optimized and useful when operating on large arrays.
We will see all the preceding constructs in the following example:
> mat <- matrix(rnorm(20), nrow=5, ncol=4)
> mat
Output:
> # row sums
> apply(mat, 1, sum)
[1] 0.79786959 0.53900665 -2.36486927 -1.28221227 0.06701519
> rowSums(mat)
[1] 0.79786959 0.53900665 -2.36486927 -1.28221227 0.06701519
> # row means
> apply(mat, 1, mean)
[1] 0.1994674 0.1347517 -0.5912173 -0.3205531 0.0167538
> rowMeans(mat)
[ 35  ]
[1] 0.79786959 0.53900665 -2.36486927 -1.28221227 0.06701519
> rowSums(mat)
[1] 0.79786959 0.53900665 -2.36486927 -1.28221227 0.06701519
> # row means
> apply(mat, 1, mean)
[1] 0.1994674 0.1347517 -0.5912173 -0.3205531 0.0167538
> rowMeans(mat)
[1] 0.1994674 0.1347517 -0.5912173 -0.3205531 0.0167538
>
> # col sums
> apply(mat, 2, sum)
[1] -0.6341087 0.3321890 -2.1345245 0.1932540
> colSums(mat)
[1] -0.6341087 0.3321890 -2.1345245 0.1932540
> apply(mat, 2, mean)
[1] -0.12682173 0.06643781 -0.42690489 0.03865079
> colMeans(mat)
[1] -0.12682173 0.06643781 -0.42690489 0.03865079
>
> # row quantiles
> apply(mat, 1, quantile, probs=c(0.25, 0.5, 0.75))
Output:
Thus you can see how easy it is to apply various statistical functions on matrices
without using loops at all.
因此,你可以看到,完全不使用循环而对矩阵应用各种统计函数是如此简单。
1.5.3 tapply 函数
tapply 函数可以用来对一个向量的子集进行函数求值。如果你熟悉关系数据库,这与应用 SQL 中的 GROUP BY 语句类似。我们将利用以下的案例进行说明:
Getting Started with R and Machine Learning
tapply
The function tapply is used to evaluate a function over the subsets of any vector.
This is similar to applying the GROUP BY construct in SQL if you are familiar with
using relational databases. We illustrate the same in the following examples:
> data <- c(1:10, rnorm(10,2), runif(10))
> data
Output:
> groups <- gl(3,10)
> groups
[1] 1 1 1 1 1 1 1 1 1 1 2 2 2 2 2 2 2 2 2 2 3 3 3 3 3 3 3 3 3 3
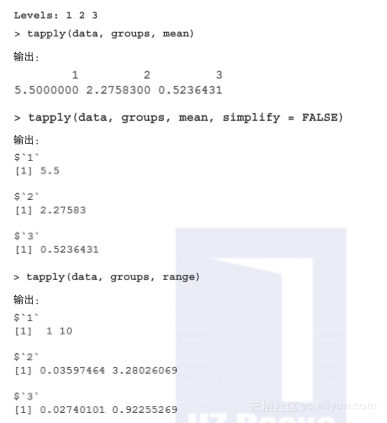
Levels: 1 2 3
> tapply(data, groups, mean)
Output: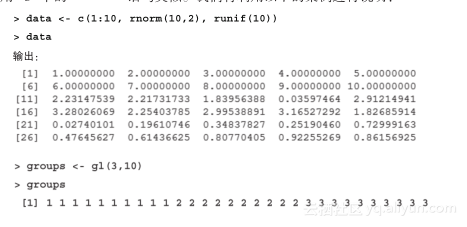
1.5.4 mapply 函数
mapply 函数是 lapply 函数的多元版本,它用于对参数集合进行并行的函数求值。举一
个简单的例子,当我们使用 rep 函数建立一个向量列表时,我们必须写多个 rep 。然而,使
用 mapply 函数我们可以通过一种更简练的方式获得同样的结果,如下所示:
Output:
mapply
The  mapply function is a multivariate version of  lapply and is used to evaluate a
function in parallel over sets of arguments. A simple example is if we have to build
a list of vectors using the  rep function, we have to write it multiple times. However,
with  mapply we can achieve the same in a more elegant way as illustrated next:
> list(rep(1,4), rep(2,3), rep(3,2), rep(4,1))
Output:
> mapply(rep, 1:4, 4:1)
1.6 进一步使用 R
在我们进行机器学习之前,有必要停顿一下,深呼吸,回顾我们之前学习的内容。这
样快速而又仔细地回顾 R 会给你之后章节的学习带来很大帮助。然而,还有两件事我们必
须马上完成。它们是如何在 R 中获得帮助以及如何操作 R 中的不同添加包。
1.6.1 获得帮助
现在,你必须已经了解了在 R 中有数千个函数和结构,你不可能也不必要了解它们中
的每一个有哪些功能。R 提供了许多直观的方式来获得就关于函数、添加包或数据结构的帮
助。你可以通过在 R 的命令提示符运行函数 help.start() ,它将打开一个手册浏览器。这
里,你将获得包括关于 R 的手册、参考文档和其他材料的详细信息。下面的命令显示了在
运行命令 help.start() 后屏幕截图中的内容,你可以使用它进一步浏览并获得更多的帮助:
Next steps with R
Befor

