标签
PostgreSQL , 优化器 , 索引扫描 , 堆扫描 , IO放大
背景
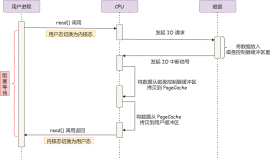
通过B-TREE索引扫描可能会带来了巨大的heap page scan数目,即IO的放大.
为什么呢?
请接下去看完本文揭晓答案。
IO放大的后果:
如果数据库的单个数据块(block_size)很大的话, 这种情况带来的负面影响也将被放大. 例如32k的block_size显然比8k的block_size扫描开销更大.
本文将讲解一下索引扫描引发的heap page scan放大的原因, 以及解决办法。 告诫大家注意这样的事情发生,以及如何对付。
正文
测试环境的成本因子如下 :
shared_buffers = 8192MB                 # min 128kB
#seq_page_cost = 1.0                    # measured on an arbitrary scale
random_page_cost = 1.0                  # same scale as above
#cpu_tuple_cost = 0.01                  # same scale as above
cpu_index_tuple_cost = 0.005            # same scale as above
#cpu_operator_cost = 0.0025             # same scale as above
effective_cache_size = 96GB
我们先创建一个测试表, 插入一些测试数据, 创建一个索引 :
digoal=> create table test_indexscan(id int, info text);
CREATE TABLE
digoal=> insert into test_indexscan select generate_series(1,5000000),md5(random()::text);
INSERT 0 5000000
digoal=> create index idx_test_indexscan_id on test_indexscan (id);
CREATE INDEX
我们查看这个表和索引占用了多少数据块.
digoal=> select relpages from pg_class where relname='test_indexscan';
 relpages
----------
    10396
(1 row)
digoal=> select relpages from pg_class where relname='idx_test_indexscan_id';
 relpages
----------
     3402
(1 row)
接下来分析以下查询, 我们看到走索引扫描, 并且扫描的数据块是13547个. (10209 +3338).
扫描的数据块和实际表占用的数据块和索引块相当.
digoal=> explain (analyze,verbose,costs,buffers,timing) select * from test_indexscan where id>90000;
                                                                           QUERY PLAN

------------------------------------------------------------------------------------------------------------------------------------
-----------------------------
 Index Scan using idx_test_indexscan_id on digoal.test_indexscan  (cost=0.43..99518.57 rows=4912065 width=37) (actual time=0.180..21
72.949 rows=4910000 loops=1)
   Output: id, info
   Index Cond: (test_indexscan.id > 90000)
   Buffers: shared hit=10209 read=3338
 Total runtime: 2674.637 ms
(5 rows)
这里使用索引扫描为什么没有带来heap page扫描的放大呢? 原因和值的顺序与物理存储顺序一致.
如下, 那么索引扫描的时候没有发生块的跳跃 :
digoal=> select correlation from pg_stats where tablename='test_indexscan' and attname='id';
 correlation
-------------
  1
(1 row)
digoal=> select ctid,id from test_indexscan limit 10;
  ctid  |   id
--------+---------
 (0,1)  | 1
 (0,2)  | 2
 (0,3)  | 3
 (0,4)  | 4
 (0,5)  | 5
 (0,6)  | 6
 (0,7)  | 7
 (0,8)  | 8
 (0,9)  | 9
 (0,10) | 10
(10 rows)
接下来我们插入随机数据, 使得索引扫描时发生heap page的跳跃.
digoal=> truncate test_indexscan ;
TRUNCATE TABLE
digoal=> insert into test_indexscan select (random()*5000000)::int,md5(random()::text) from generate_series(1,100000);
INSERT 0 100000
查询当前的ID列的顺性, 非常小, 说明这个值非常的离散.
digoal=> select correlation from pg_stats where tablename='test_indexscan' and attname='id';
 correlation
-------------
  0.00986802
(1 row)
从数据分布结果中也能看到这点.
digoal=> select ctid,id from test_indexscan limit 10;
  ctid  |   id
--------+---------
 (0,1)  | 4217216
 (0,2)  | 2127868
 (0,3)  | 2072952
 (0,4)  |   62641
 (0,5)  | 4927312
 (0,6)  | 3000894
 (0,7)  | 2799439
 (0,8)  | 4165217
 (0,9)  | 2446438
 (0,10) | 2835211
(10 rows)
按以下顺序扫描, 显然会出现大量的数据块的跳跃.
digoal=> select id,ctid from test_indexscan order by id limit 10;
 id  |   ctid
-----+-----------
  56 | (192,318)
  73 | (119,163)
 218 | (189,2)
 235 | (7,209)
 260 | (41,427)
 340 | (37,371)
 548 | (118,363)
 607 | (143,174)
 690 | (161,38)
 714 | (1,21)
(10 rows)
当前这个表和索引占用的数据块如下 :
digoal=> select relpages from pg_class where relname='test_indexscan';
 relpages
----------
      208
(1 row)

digoal=> select relpages from pg_class where relname='idx_test_indexscan_id';
 relpages
----------
       86
(1 row)
接下来我们执行这个SQL, 发现走索引扫描了, 但是显然shared hit变得非常的大, 原因就是每扫描一个索引条目, 对应到heap page number都是跳跃的. 造成了heap page扫描的放大. 具体放大多少行呢, 和差出来的行差不多.
digoal=> explain (analyze,verbose,costs,buffers,timing) select * from test_indexscan where id>90000;
                                                                        QUERY PLAN

------------------------------------------------------------------------------------------------------------------------------------
----------------------
 Index Scan using idx_test_indexscan_id on digoal.test_indexscan  (cost=0.29..2035.38 rows=99719 width=37) (actual time=0.027..87.45
6 rows=98229 loops=1)
   Output: id, info
   Index Cond: (test_indexscan.id > 90000)
   Buffers: shared hit=97837
 Total runtime: 97.370 ms
(5 rows)
heap page scan放大评估和索引扫描了多少条目有关, 但至少有98229个条目 :
digoal=> select count(*) from test_indexscan where id>90000;
 count
-------
 98229
(1 row)
如果纯随机扫描, 那么将要扫描98229次heap page. 也就不难理解这里的Buffers: shared hit=97837.
但是实际上, PostgreSQL的优化器似乎没有关注这些开销, 因为我们看到的成本只有2035.38 (这里和random_page_cost以及effective_cache_size 大于整个表和索引的空间有关)
接下来把random_page_cost设置为2和1, 两个cost相减, 看看到底优化器评估了多少个块扫描.
digoal=> set random_page_cost=2;
SET
digoal=> set enable_seqscan=off;
SET
digoal=> explain (analyze,verbose,costs,buffers,timing) select * from test_indexscan where id>90000;
                                                                        QUERY PLAN

------------------------------------------------------------------------------------------------------------------------------------
----------------------
 Index Scan using idx_test_indexscan_id on digoal.test_indexscan  (cost=0.29..2305.73 rows=98255 width=37) (actual time=0.045..81.76
8 rows=98229 loops=1)
   Output: id, info
   Index Cond: (test_indexscan.id > 90000)
   Buffers: shared hit=97837
 Total runtime: 92.186 ms
(5 rows)

digoal=> set random_page_cost=1;
SET
digoal=> explain (analyze,verbose,costs,buffers,timing) select * from test_indexscan where id>90000;
                                                                        QUERY PLAN

------------------------------------------------------------------------------------------------------------------------------------
----------------------
 Index Scan using idx_test_indexscan_id on digoal.test_indexscan  (cost=0.29..2012.75 rows=98255 width=37) (actual time=0.028..80.05
5 rows=98229 loops=1)
   Output: id, info
   Index Cond: (test_indexscan.id > 90000)
   Buffers: shared hit=97837
 Total runtime: 90.549 ms
(5 rows)
相减得到293, 即优化器认为index scan需要扫描293个数据块.
digoal=> select 2305-2012;
 ?column?
----------
      293
(1 row)
接下来我把enable_indexscan关闭, 让优化器选择bitmap scan.
digoal=> set enable_indexscan=off;
SET
digoal=> explain (analyze,verbose,costs,buffers,timing) select * from test_indexscan where id>90000;
                                                                QUERY PLAN

------------------------------------------------------------------------------------------------------------------------------------
 Bitmap Heap Scan on digoal.test_indexscan  (cost=846.77..2282.96 rows=98255 width=37) (actual time=15.291..35.911 rows=98229 loops=
1)
   Output: id, info
   Recheck Cond: (test_indexscan.id > 90000)
   Buffers: shared hit=292
   ->  Bitmap Index Scan on idx_test_indexscan_id  (cost=0.00..822.21 rows=98255 width=0) (actual time=15.202..15.202 rows=98229 loo
ps=1)
         Index Cond: (test_indexscan.id > 90000)
         Buffers: shared hit=84
 Total runtime: 45.838 ms
(8 rows)
从bitmap scan的结果可以看到, 实际扫描的块为292个, 相比index scan少扫描了9.7万多数据块. 并且实际的执行时间也是bitmap scan要快很多.
本例PostgreSQL在计算index scan的random page的成本时, 评估得到的index scan成本小于bitmap index scan的成本, 然而实际上当correlation 很小时, index scan会扫描更多次的heap page, 成本远远大于bitmap scan.
本例发生这样的情况, 具体的原因和我们的成本因子设置有关系, 因为错误的设置了random_page_cost以及表和索引的大小小于effective_cache_size, PostgreSQL在使用这样的成本因子计算成本时, 出现了bitmap scan大于index scan成本的结果.
所以设置正确的成本因子非常重要, 这也是我们需要校准成本因子的原因.
例子 :
[postgres@digoal pgdata]$ psql
psql (9.3.4)
Type "help" for help.
默认的成本因子如下
digoal=# show seq_page_cost;
 seq_page_cost
---------------
 1
(1 row)

digoal=# show random_page_cost;
 random_page_cost
------------------
 4
(1 row)

digoal=# show cpu_tuple_cost;
 cpu_tuple_cost
----------------
 0.01
(1 row)

digoal=# show cpu_index_tuple_cost;
 cpu_index_tuple_cost
----------------------
 0.005
(1 row)

digoal=# show cpu_operator_cost;
 cpu_operator_cost
-------------------
 0.0025
(1 row)

digoal=# show effective_cache_size;
 effective_cache_size
----------------------
 128MB
(1 row)
表和索引的大小如下
digoal=# \dt+ tbl_cost_align
                         List of relations
 Schema |      Name      | Type  |  Owner   |  Size  | Description
--------+----------------+-------+----------+--------+-------------
 public | tbl_cost_align | table | postgres | 219 MB |
(1 row)

digoal=# \di+ tbl_cost_align_id
                                  List of relations
 Schema |       Name        | Type  |  Owner   |     Table      | Size  | Description
--------+-------------------+-------+----------+----------------+-------+-------------
 public | tbl_cost_align_id | index | postgres | tbl_cost_align | 64 MB |
(1 row)
把random_page_cost校准为10, 这个在一般的硬件环境中都适用.
digoal=# set random_page_cost=10;
SET
默认选择了全表扫描
digoal=# explain (analyze,costs,buffers,timing,verbose) select * from tbl_cost_align where id>2000000;
                                                            QUERY PLAN
-----------------------------------------------------------------------------------------------------------------------------------
 Seq Scan on public.tbl_cost_align  (cost=0.00..65538.00 rows=2996963 width=45) (actual time=0.050..1477.028 rows=2997015 loops=1)
   Output: id, info, crt_time
   Filter: (tbl_cost_align.id > 2000000)
   Rows Removed by Filter: 2985
   Buffers: shared hit=28038
 Total runtime: 2011.742 ms
(6 rows)
关闭全表扫描后, 选择了bitmap scan
digoal=# set enable_seqscan=off;
SET
digoal=# explain (analyze,costs,buffers,timing,verbose) select * from tbl_cost_align where id>2000000;
                                                                     QUERY PLAN

------------------------------------------------------------------------------------------------------------------------------------
----------------
 Bitmap Heap Scan on public.tbl_cost_align  (cost=105426.89..170926.93 rows=2996963 width=45) (actual time=1221.104..2911.889 rows=2
997015 loops=1)
   Output: id, info, crt_time
   Recheck Cond: (tbl_cost_align.id > 2000000)
   Rows Removed by Index Recheck: 2105
   Buffers: shared hit=36229
   ->  Bitmap Index Scan on tbl_cost_align_id  (cost=0.00..104677.65 rows=2996963 width=0) (actual time=1214.865..1214.865 rows=2997
015 loops=1)
         Index Cond: (tbl_cost_align.id > 2000000)
         Buffers: shared hit=8191
 Total runtime: 3585.699 ms
(9 rows)
关闭bitmap scan后选择了index scan, index scan的cost远远大于评估到的bitmap scan. 因为我们使用了正确的成本因子.
digoal=# set enable_bitmapscan=off;
SET
digoal=# explain (analyze,costs,buffers,timing,verbose) select * from tbl_cost_align where id>2000000;
                                                                           QUERY PLAN

------------------------------------------------------------------------------------------------------------------------------------
----------------------------
 Index Scan using tbl_cost_align_id on public.tbl_cost_align  (cost=0.43..16601388.04 rows=2996963 width=45) (actual time=0.064..566
2.361 rows=2997015 loops=1)
   Output: id, info, crt_time
   Index Cond: (tbl_cost_align.id > 2000000)
   Buffers: shared hit=3005084
 Total runtime: 6173.067 ms
(5 rows)
当错误的设置了random_page_cost=1=seq_page_cost时, 执行计划会有所改变(改变出现在effective_cache_size大于表和索引的大小时).
the wrong plan cost occur when i set random_page_cost to 1, and effective_cache_size big then index size and table size in this case.
重新进入psql, 所有因子重回默认值.
digoal=# set random_page_cost=1;
SET
digoal=# explain (analyze,costs,buffers,timing,verbose) select * from tbl_cost_align where id>2000000;
                                                            QUERY PLAN
-----------------------------------------------------------------------------------------------------------------------------------
 Seq Scan on public.tbl_cost_align  (cost=0.00..65538.00 rows=2996963 width=45) (actual time=0.040..1692.712 rows=2997015 loops=1)
   Output: id, info, crt_time
   Filter: (tbl_cost_align.id > 2000000)
   Rows Removed by Filter: 2985
   Buffers: shared hit=28038
 Total runtime: 2249.313 ms
(6 rows)
目前看来还正确
digoal=# set enable_seqscan=off;
SET
digoal=# explain (analyze,costs,buffers,timing,verbose) select * from tbl_cost_align where id>2000000;
                                                                    QUERY PLAN

------------------------------------------------------------------------------------------------------------------------------------
--------------
 Bitmap Heap Scan on public.tbl_cost_align  (cost=31446.89..96946.93 rows=2996963 width=45) (actual time=1224.445..2454.797 rows=299
7015 loops=1)
   Output: id, info, crt_time
   Recheck Cond: (tbl_cost_align.id > 2000000)
   Rows Removed by Index Recheck: 2105
   Buffers: shared hit=36229
   ->  Bitmap Index Scan on tbl_cost_align_id  (cost=0.00..30697.65 rows=2996963 width=0) (actual time=1220.404..1220.404 rows=29970
15 loops=1)
         Index Cond: (tbl_cost_align.id > 2000000)
         Buffers: shared hit=8191
 Total runtime: 2955.816 ms
(9 rows)
当effective_cache_size还是小于表和索引时, 执行计划依旧正确
digoal=# set effective_cache_size='280MB';
SET
digoal=# explain (analyze,costs,buffers,timing,verbose) select * from tbl_cost_align where id>2000000;
                                                                   QUERY PLAN

------------------------------------------------------------------------------------------------------------------------------------
-------------
 Bitmap Heap Scan on public.tbl_cost_align  (cost=31446.89..96946.93 rows=2996963 width=45) (actual time=963.845..2060.463 rows=2997
015 loops=1)
   Output: id, info, crt_time
   Recheck Cond: (tbl_cost_align.id > 2000000)
   Rows Removed by Index Recheck: 2105
   Buffers: shared hit=36229
   ->  Bitmap Index Scan on tbl_cost_align_id  (cost=0.00..30697.65 rows=2996963 width=0) (actual time=959.673..959.673 rows=2997015
 loops=1)
         Index Cond: (tbl_cost_align.id > 2000000)
         Buffers: shared hit=8191
 Total runtime: 2515.649 ms
(9 rows)
当effective_cache_size大于表和索引的大小时, index scan的成本低于bitmap scan的成本了.
When effective_cache_size large then table and index's size. then use index scan first than bitmap scan.
digoal=# set effective_cache_size='283MB';
SET
digoal=# explain (analyze,costs,buffers,timing,verbose) select * from tbl_cost_align where id>2000000;
                                                                         QUERY PLAN

------------------------------------------------------------------------------------------------------------------------------------
-------------------------
 Index Scan using tbl_cost_align_id on public.tbl_cost_align  (cost=0.43..92030.24 rows=2996963 width=45) (actual time=0.045..5238.3
61 rows=2997015 loops=1)
   Output: id, info, crt_time
   Index Cond: (tbl_cost_align.id > 2000000)
   Buffers: shared hit=3005084
 Total runtime: 5689.583 ms
(5 rows)
如果这个时候再把random_page_cost调回正常值10, 则执行计划回归正常.
digoal=# set random_page_cost=10;
SET
digoal=# explain (analyze,costs,buffers,timing,verbose) select * from tbl_cost_align where id>2000000;
                                                                    QUERY PLAN

------------------------------------------------------------------------------------------------------------------------------------
---------------
 Bitmap Heap Scan on public.tbl_cost_align  (cost=105426.89..170926.93 rows=2996963 width=45) (actual time=918.225..2195.414 rows=29
97015 loops=1)
   Output: id, info, crt_time
   Recheck Cond: (tbl_cost_align.id > 2000000)
   Rows Removed by Index Recheck: 2105
   Buffers: shared hit=36229
   ->  Bitmap Index Scan on tbl_cost_align_id  (cost=0.00..104677.65 rows=2996963 width=0) (actual time=913.935..913.935 rows=299701
5 loops=1)
         Index Cond: (tbl_cost_align.id > 2000000)
         Buffers: shared hit=8191
 Total runtime: 2698.429 ms
(9 rows)

digoal=# set enable_seqscan=on;
SET
digoal=# explain (analyze,costs,buffers,timing,verbose) select * from tbl_cost_align where id>2000000;
                                                            QUERY PLAN
-----------------------------------------------------------------------------------------------------------------------------------
 Seq Scan on public.tbl_cost_align  (cost=0.00..65538.00 rows=2996963 width=45) (actual time=0.020..1522.791 rows=2997015 loops=1)
   Output: id, info, crt_time
   Filter: (tbl_cost_align.id > 2000000)
   Rows Removed by Filter: 2985
   Buffers: shared hit=28038
 Total runtime: 2104.057 ms
(6 rows)
本例说明了成本因子的重要性. 千万不能随意设置, 即使完全内存命中, random_page_cost也应该大于seq_page_cost.
我在前一篇BLOG中测试了这样的场景, 完全内存命中的场景可以设置 random_page_cost=1.6; seq_page_cost=1;
《优化器成本因子校对 - PostgreSQL explain cost constants alignment to timestamp》
B-TREE扫描,对于线性相关性不好的列,会放大HEAP SCAN 的IO消耗,使用bitmap可以解决。
线性相关性的知识如下
《PostgreSQL 计算 任意类型 字段之间的线性相关性》
《PostgreSQL 统计信息之 - 逻辑与物理存储的线性相关性》
小结
1. 当字段的存储与值线性相关性差时,使用index scan会导致大量的HEAP SCAN IO放大。
2. bitmap index scan巧妙的解决了放大的问题,bitmap index scan对index item按照ctid(heap行号)排序后再取数据,避免了单个HEAP PAGE的重复IO。
3. 使用cluster对heap数据按索引顺序进行重排,也可以解决HEAP SCAN IO放大的问题。
参考
2. 《优化器成本因子校对 - PostgreSQL explain cost constants alignment to timestamp》
3. src/backend/optimizer/path/costsize.c
cost_index function :
        /*
         * Now interpolate based on estimated index order correlation to get total
         * disk I/O cost for main table accesses.
         */
        csquared = indexCorrelation * indexCorrelation;

        run_cost += max_IO_cost + csquared * (min_IO_cost - max_IO_cost);