
参考资料:
1.Web 技术研究所
2.Web_Audio_API
0.启发
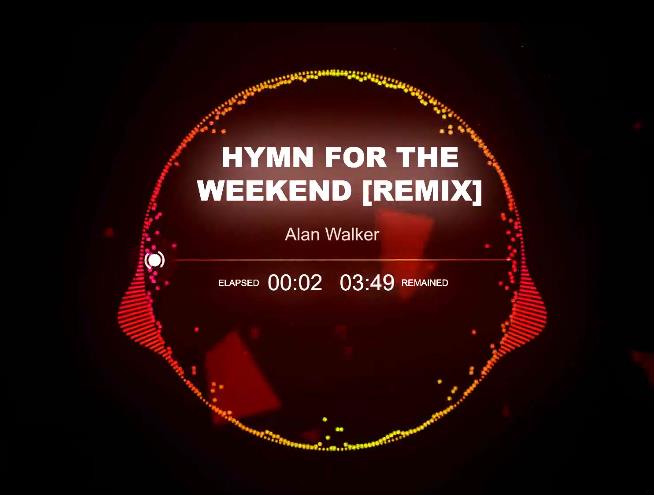
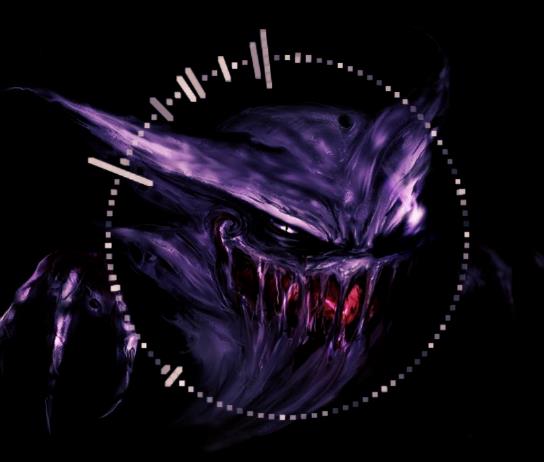
在B站我们有很多的小伙伴们应该都看到过用AE做的可视化音乐播放器播放音乐的视频,看着特别酷炫带感有木有。
B站截图

B站截图
B站截图
所以今天我就用 Canvas 做个简单 环形频谱图。
那么~ ヾ(o・ω・)ノ 开始吧!
1.首先绘制静态的效果
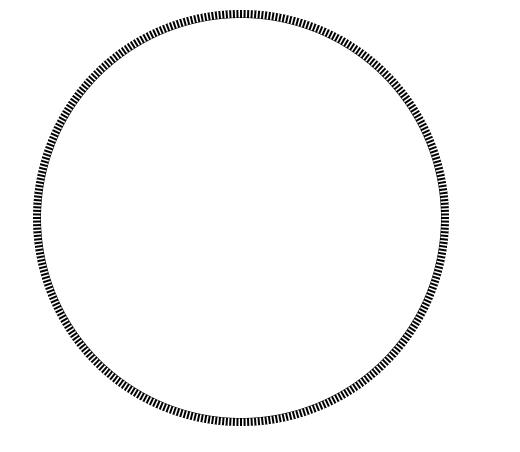
静态效果
绘制静态效果很简单,我们只要从一点出发根据一定角度绘制线条,然后画个圆从中点开始覆盖线条就行了
<canvas id="wrap" height="800" width="800"></canvas>
<script>
var wrap = document.getElementById("wrap");
var cxt = wrap.getContext("2d");
(function drawSpectrum() {
cxt.clearRect(0, 0, wrap.width, wrap.height);
//画线条
for (var i = 0; i < 360; i++) {
var value = 8;
cxt.beginPath();
cxt.lineWidth = 2;
cxt.moveTo(300, 300);
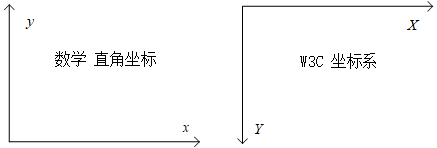
//R * cos (PI/180*一次旋转的角度数) ,-R * sin (PI/180*一次旋转的角度数)
cxt.lineTo(Math.cos((i * 1) / 180 * Math.PI) * (200 + value) + 300, (- Math.sin((i * 1) / 180 * Math.PI) * (200 + value) + 300));
cxt.stroke();
}
//画一个小圆,将线条覆盖
cxt.beginPath();
cxt.lineWidth = 1;
cxt.arc(300, 300, 200, 0, 2 * Math.PI, false);
cxt.fillStyle = "#fff";
cxt.stroke();
cxt.fill();
})();
</script>
2.调用AudioAPI,绘制音乐的频谱图
绘制音乐的频谱图
第一步完成后,第二步就很简单了,通过调用AudioAPI获取音频变化来改变线条长度。
注意!!!最新chrome浏览器可能需要在http服务器上运行~
你可以参考文章绘制音乐的频谱图(使用Analyser节点)
<input type="button" onclick="audio.play()" value="播放" />
<input type="button" onclick="audio.pause()" value="暂停" />
<canvas id="wrap" height="800" width="800"></canvas>
<script>
    var wrap = document.getElementById("wrap");
    var cxt = wrap.getContext("2d");
    //获取API
    var AudioContext = AudioContext || webkitAudioContext;
    var context = new AudioContext;
    //加载媒体
    var audio = new Audio("demo.mp3");
    //创建节点
    var source = context.createMediaElementSource(audio);
    var analyser = context.createAnalyser();
    //连接:source → analyser → destination
    source.connect(analyser);
    analyser.connect(context.destination);
    //创建数据
    var output = new Uint8Array(360);
    (function drawSpectrum() {
        analyser.getByteFrequencyData(output);//获取频域数据
        cxt.clearRect(0, 0, wrap.width, wrap.height);
        //画线条
        for (var i = 0; i < 360; i++) {
            var value = output[i] / 8;//<===获取数据
            cxt.beginPath();
            cxt.lineWidth = 2;
            cxt.moveTo(300, 300);
            //R * cos (PI/180*一次旋转的角度数) ,-R * sin (PI/180*一次旋转的角度数)
            cxt.lineTo(Math.cos((i * 1) / 180 * Math.PI) * (200 + value) + 300, (- Math.sin((i * 1) / 180 * Math.PI) * (200 + value) + 300));
            cxt.stroke();
        }
        //画一个小圆,将线条覆盖
        cxt.beginPath();
        cxt.lineWidth = 1;
        cxt.arc(300, 300, 200, 0, 2 * Math.PI, false);
        cxt.fillStyle = "#fff";
        cxt.stroke();
        cxt.fill();
        //请求下一帧
        requestAnimationFrame(drawSpectrum);
    })();
</script>
3.环形左右同步显示
实习步骤2后其实已经完成一大半了,不过细心的小伙伴们会发现环形最右端点上的线条间差了好多。
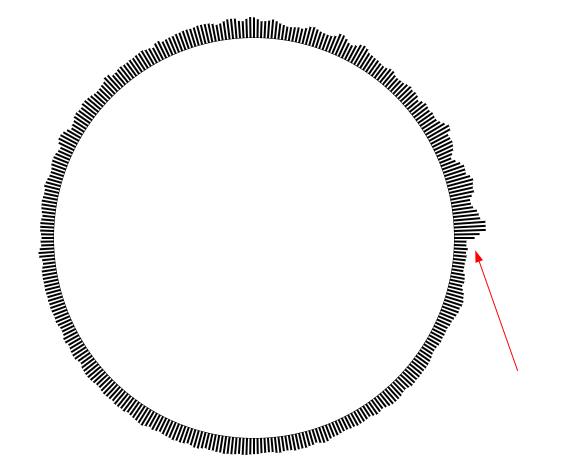
demo
处理办法很多,我们用其中一个简单的办法处理,那就是让其左右对称的显示。
<input type="button" onclick="audio.play()" value="播放" />
<input type="button" onclick="audio.pause()" value="暂停" />
<canvas id="wrap" height="550" width="800"></canvas>
<script>
    var wrap = document.getElementById("wrap");
    var cxt = wrap.getContext("2d");
    //获取API
    var AudioContext = AudioContext || webkitAudioContext;
    var context = new AudioContext;
    //加载媒体
    var audio = new Audio("demo.mp3");
    //创建节点
    var source = context.createMediaElementSource(audio);
    var analyser = context.createAnalyser();
    //连接:source → analyser → destination
    source.connect(analyser);
    analyser.connect(context.destination);
    //创建数据
    var output = new Uint8Array(361);
    (function drawSpectrum() {
        analyser.getByteFrequencyData(output);//获取频域数据
        cxt.clearRect(0, 0, wrap.width, wrap.height);
        //画线条
        for (var i = 0; i < output.length; i++) {
            var value = output[i] / 10;
            //绘制左半边
            cxt.beginPath();
            cxt.lineWidth = 1;
            cxt.moveTo(300, 300);
            cxt.lineTo(Math.cos((i *0.5 + 90) / 180 * Math.PI) * (200 + value) + 300, (- Math.sin((i *0.5 + 90) / 180 * Math.PI) * (200 + value) + 300));
            cxt.stroke();
            //绘制右半边
            cxt.beginPath();
            cxt.lineWidth = 1;
            cxt.moveTo(300, 300);
            cxt.lineTo( (Math.sin((i *0.5) / 180 * Math.PI) * (200 + value) + 300),-Math.cos((i *0.5) / 180 * Math.PI) * (200 + value) + 300);
            cxt.stroke();
        }
        //画一个小圆,将线条覆盖
        cxt.beginPath();
        cxt.lineWidth = 1;
        cxt.arc(300, 300, 200, 0, 2 * Math.PI, false);
        cxt.fillStyle = "#fff";
        cxt.stroke();
        cxt.fill();
        //请求下一帧
        requestAnimationFrame(drawSpectrum);
    })();
</script>
效果
4.添加波形图
最后我们来尝试在圈内,添加一个波形图
你可以参考文章绘制音乐的波形图(使用Analyser节点)
 示例
示例
<input type="button" onclick="audio.play()" value="播放" />
<input type="button" onclick="audio.pause()" value="暂停" />
<canvas id="wrap" height="550" width="800"></canvas>
<script>
    var wrap = document.getElementById("wrap");
    var cxt = wrap.getContext("2d");
    //获取API
    var AudioContext = AudioContext || webkitAudioContext;
    var context = new AudioContext;
    //加载媒体
    var audio = new Audio("demo.mp3");
    //创建节点
    var source = context.createMediaElementSource(audio);
    var analyser = context.createAnalyser();
    //连接:source → analyser → destination
    source.connect(analyser);
    analyser.connect(context.destination);
    //创建数据
    var output = new Uint8Array(361);
    //计算出采样频率44100所需的缓冲区长度
    var length = analyser.frequencyBinCount * 44100 / context.sampleRate | 0;
    //创建数据
    var output2 = new Uint8Array(length);
    (function drawSpectrum() {
        analyser.getByteFrequencyData(output);//获取频域数据
        cxt.clearRect(0, 0, wrap.width, wrap.height);
        //画线条
        for (var i = 0; i < output.length; i++) {
            var value = output[i] / 10;
            //绘制左半边
            cxt.beginPath();
            cxt.lineWidth = 1;
            cxt.moveTo(300, 300);
            cxt.lineTo(Math.cos((i * 0.5 + 90) / 180 * Math.PI) * (200 + value) + 300, (- Math.sin((i * 0.5 + 90) / 180 * Math.PI) * (200 + value) + 300));
            cxt.stroke();
            //绘制右半边
            cxt.beginPath();
            cxt.lineWidth = 1;
            cxt.moveTo(300, 300);
            cxt.lineTo((Math.sin((i * 0.5) / 180 * Math.PI) * (200 + value) + 300), -Math.cos((i * 0.5) / 180 * Math.PI) * (200 + value) + 300);
            cxt.stroke();
        }
        //画一个小圆,将线条覆盖
        cxt.beginPath();
        cxt.lineWidth = 1;
        cxt.arc(300, 300, 200, 0, 2 * Math.PI, false);
        cxt.fillStyle = "#fff";
        cxt.stroke();
        cxt.fill();
        //将缓冲区的数据绘制到Canvas上
        analyser.getByteTimeDomainData(output2);
        var height = 100, width = 400;
        cxt.beginPath();
        for (var i = 0; i < width; i++) {
            cxt.lineTo(i + 100, 300 - (height / 2 * (output2[output2.length * i / width | 0] / 256 - 0.5)));
        }
        cxt.stroke();
        //请求下一帧
        requestAnimationFrame(drawSpectrum);
    })();
</script>
5.尝试波形反向显示
如果是波形向圆形内显示 又改如何实现呢?
起始也很简单稍微改下上面的代码就可以了
首先我们要去掉圆形覆盖,用空心圆代替
<input type="button" onclick="audio.play()" value="播放" />
<input type="button" onclick="audio.pause()" value="暂停" />
<canvas id="wrap" height="800" width="800"></canvas>
<script>
    var wrap = document.getElementById("wrap");
    var cxt = wrap.getContext("2d");
    //获取API
    var AudioContext = AudioContext || webkitAudioContext;
    var context = new AudioContext;
    //加载媒体
    var audio = new Audio('demo.mp3');
    //创建节点
    var source = context.createMediaElementSource(audio);
    var analyser = context.createAnalyser();
    //连接:source → analyser → destination
    source.connect(analyser);
    analyser.connect(context.destination);
    //创建数据
    var output = new Uint8Array(180);
    var du = 2;//角度
    var potInt = { x: 300, y: 300 };//起始坐标
    var R = 200;//半径
    var W = 2;//宽
    (function drawSpectrum() {
        analyser.getByteFrequencyData(output);//获取频域数据
        cxt.clearRect(0, 0, wrap.width, wrap.height);
        //画线条
        for (var i = 0; i < 180; i++) {
            var value = output[i] / 10;//<===获取数据
            cxt.beginPath();
            cxt.lineWidth = W;
            cxt.moveTo(( Math.sin((i * du) / 180 * Math.PI) * R + potInt.y),-Math.cos((i * du) / 180 * Math.PI) * R + potInt.x);//从圆边开始
            Rv = (R + value);
            cxt.lineTo( ( Math.sin((i * du) / 180 * Math.PI) * Rv + potInt.y),-Math.cos((i * du) / 180 * Math.PI) * Rv + potInt.x);
            cxt.stroke();
        }
        cxt.fill();
        //画一个空心小圆,将线条覆盖
        cxt.beginPath();
        cxt.lineWidth = 1;
        cxt.arc(300, 300, 200, 0, 2 * Math.PI, false);
        cxt.stroke();
        cxt.closePath();
        //请求下一帧
        requestAnimationFrame(drawSpectrum);
    })();
</script>
示例
接下去就简单了 只要让圆半径减去对应值就行了
<input type="button" onclick="audio.play()" value="播放" />
<input type="button" onclick="audio.pause()" value="暂停" />
<canvas id="wrap" height="800" width="800"></canvas>
<script>
    var wrap = document.getElementById("wrap");
    var cxt = wrap.getContext("2d");
    //获取API
    var AudioContext = AudioContext || webkitAudioContext;
    var context = new AudioContext;
    //加载媒体
    var audio = new Audio('demo.mp3');
    //创建节点
    var source = context.createMediaElementSource(audio);
    var analyser = context.createAnalyser();
    //连接:source → analyser → destination
    source.connect(analyser);
    analyser.connect(context.destination);
    //创建数据
    var output = new Uint8Array(180);
    var du = 2;//角度
    var potInt = { x: 300, y: 300 };//起始坐标
    var R = 200;//半径
    var W = 2;//宽
    (function drawSpectrum() {
        analyser.getByteFrequencyData(output);//获取频域数据
        cxt.clearRect(0, 0, wrap.width, wrap.height);
        //画线条
        for (var i = 0; i < 180; i++) {
            var value = output[i] / 10;//<===获取数据
            cxt.beginPath();
            cxt.lineWidth = W;
            Rv = (R -value);
            cxt.moveTo(( Math.sin((i * du) / 180 * Math.PI) * R + potInt.y),-Math.cos((i * du) / 180 * Math.PI) * R + potInt.x);
            cxt.lineTo( ( Math.sin((i * du) / 180 * Math.PI) * Rv + potInt.y),-Math.cos((i * du) / 180 * Math.PI) * Rv + potInt.x);
            cxt.stroke();
        }
        cxt.fill();
        //画一个空心小圆,将线条覆盖
        cxt.beginPath();
        cxt.lineWidth = 1;
        cxt.arc(300, 300, 200, 0, 2 * Math.PI, false);
        cxt.stroke();
        cxt.closePath();
        //请求下一帧
        requestAnimationFrame(drawSpectrum);
    })();
</script>
示例
6.双向显示
既然实现了反向显示了那双向显示也就很简单了
<input type="button" onclick="audio.play()" value="播放" />
<input type="button" onclick="audio.pause()" value="暂停" />
<canvas id="wrap" height="800" width="800"></canvas>
<script>
    var wrap = document.getElementById("wrap");
    var cxt = wrap.getContext("2d");
    //获取API
    var AudioContext = AudioContext || webkitAudioContext;
    var context = new AudioContext;
    //加载媒体
    var audio = new Audio('demo.mp3');
    //创建节点
    var source = context.createMediaElementSource(audio);
    var analyser = context.createAnalyser();
    //连接:source → analyser → destination
    source.connect(analyser);
    analyser.connect(context.destination);
    //创建数据
    var output = new Uint8Array(180);
    var du = 2;//角度
    var potInt = { x: 300, y: 300 };//起始坐标
    var R = 200;//半径
    var W = 4;//宽
    (function drawSpectrum() {
        analyser.getByteFrequencyData(output);//获取频域数据
        cxt.clearRect(0, 0, wrap.width, wrap.height);
        //画线条
        for (var i = 0; i < 180; i++) {
            var value = output[i] / 10;//<===获取数据
            cxt.beginPath();
            cxt.lineWidth = W;
            Rv1 = (R -value);
            Rv2 = (R +value);
            cxt.moveTo(( Math.sin((i * du) / 180 * Math.PI) * Rv1 + potInt.y),-Math.cos((i * du) / 180 * Math.PI) * Rv1 + potInt.x);
            cxt.lineTo( ( Math.sin((i * du) / 180 * Math.PI) * Rv2 + potInt.y),-Math.cos((i * du) / 180 * Math.PI) * Rv2 + potInt.x);
            cxt.stroke();
        }
        cxt.fill();
        //画一个空心小圆,将线条覆盖
        cxt.beginPath();
        cxt.lineWidth = 1;
        cxt.arc(300, 300, 200, 0, 2 * Math.PI, false);
        cxt.stroke();
        cxt.closePath();
        //请求下一帧
        requestAnimationFrame(drawSpectrum);
    })();
</script>
示例
添加自己的创意
添加自己的创意