Grafana是一个开源的度量分析与可视化套件。经常被用作基础设施的时间序列数据和应用程序分析的可视化,我们这里用它来做Kubernetes集群监控数据的可视化。本文将采取kubectl命令的方式部署Grafana。
准备工作
- Kubernetes集群,如果你还没有搭建好Kubernetes集群,可以参考这篇文章-Kubernetes-离线部署Kubernetes 1.9.0;
- Prometheus监控组件,可以参考这篇文章-Prometheus-使用Prometheus监控Kubernetes集群;
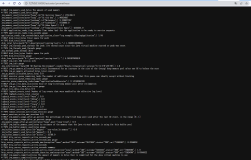
- Grafana镜像,截至笔者写这篇文章之时,最新的版本是5.2.2,但是如果使用该版本搭建,并且使用外挂存储的话,会出现以下错误
kubectl logs pod/grafanademo-5c4ff67949-pvcrs GF_PATHS_DATA='/var/lib/grafana' is not writable. You may have issues with file permissions, more information here: http://docs.grafana.org/installation/docker/#migration-from-a-previous-version-of-the-docker-container-to-5-1-or-later mkdir: cannot create directory '/var/lib/grafana/plugins': Permission denied
这是因为Grafana启动使用的用户和用户组都是472,造成对外挂存储没有权限,有人参考这里的方案给解决了,但是笔者没有测试通过,所以退而求其次,使用5.0.0版本进行搭建。
部署Grafana
新建以下yaml文件
grafana-dashboard-provider.yaml
apiVersion: v1
kind: ConfigMap
metadata:
  name: grafana-dashboard-provider
  namespace: monitoring
data:
  default-dashboard.yaml: |
    - name: 'default'
      org_id: 1
      folder: ''
      type: file
      options:
        folder: /var/lib/grafana/dashboards
grafana.yaml
apiVersion: extensions/v1beta1
kind: Deployment
metadata:
  name: grafana
  namespace: monitoring
  labels:
    app: grafana
    component: core
spec:
  replicas: 1
  template:
    metadata:
      labels:
        app: grafana
        component: core
    spec:
      containers:
        - image: registry.docker.uih/library/grafana:5.0.0
          name: grafana
          ports:
          - containerPort: 3000
          resources:
            limits:
              cpu: 100m
              memory: 100Mi
            requests:
              cpu: 100m
              memory: 100Mi
          volumeMounts:
          - name: grafana-persistent-storage
            mountPath: /var
          - name: grafana-datasources
            mountPath: /etc/grafana/provisioning/datasources
          - name: grafana-dashboard-provider
            mountPath: /etc/grafana/provisioning/dashboards
          - name: grafana-dashboards
            mountPath: /var/lib/grafana/dashboards
      volumes:
      - name: grafana-datasources
        configMap:
          name: grafana-datasources
      - name: grafana-dashboards
        configMap:
          name: grafana-dashboards
      - name: grafana-dashboard-provider
        configMap:
          name: grafana-dashboard-provider
      - name: grafana-persistent-storage
        emptyDir: {}
grafana-service.yaml
apiVersion: v1
kind: Service
metadata:
  labels:
    name: grafana
  name: grafana
  namespace: monitoring
spec:
  type: NodePort
  selector:
    app: grafana
  ports:
  - protocol: TCP
    port: 3000
    targetPort: 3000
    nodePort: 30300
执行如下命令进行创建
kubectl create -f grafana-dashboard-provider.yaml -f grafana.yaml -f grafana-service.yaml
部署完成后通过Kubernetes Dashboard可以看到
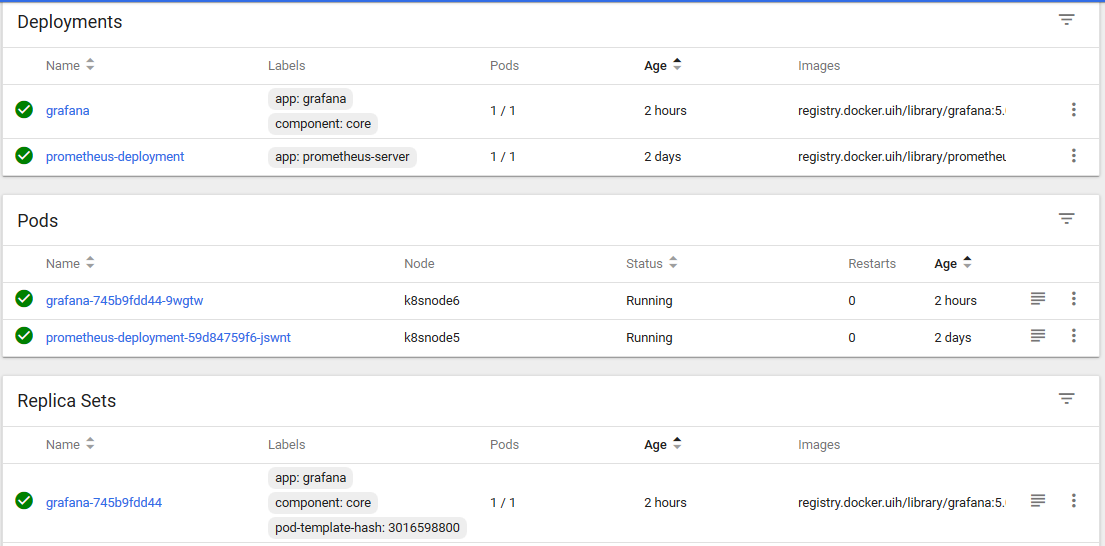
Dashboard
根据服务暴露出来的端口30300通过浏览器访问【http://10.3.14.193:30300】看到如下界面:

Grafana login
输入用户名和密码(admin/admin)即可登录
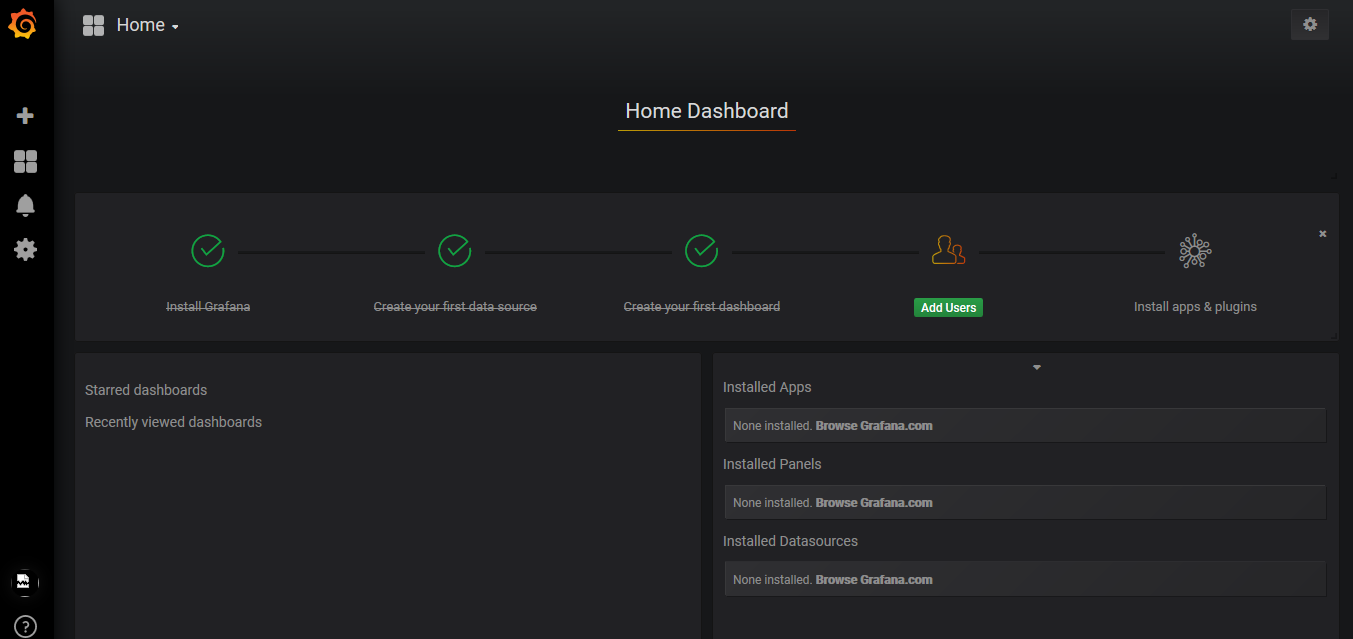
Grafana Dashboard
接着我们配置数据源
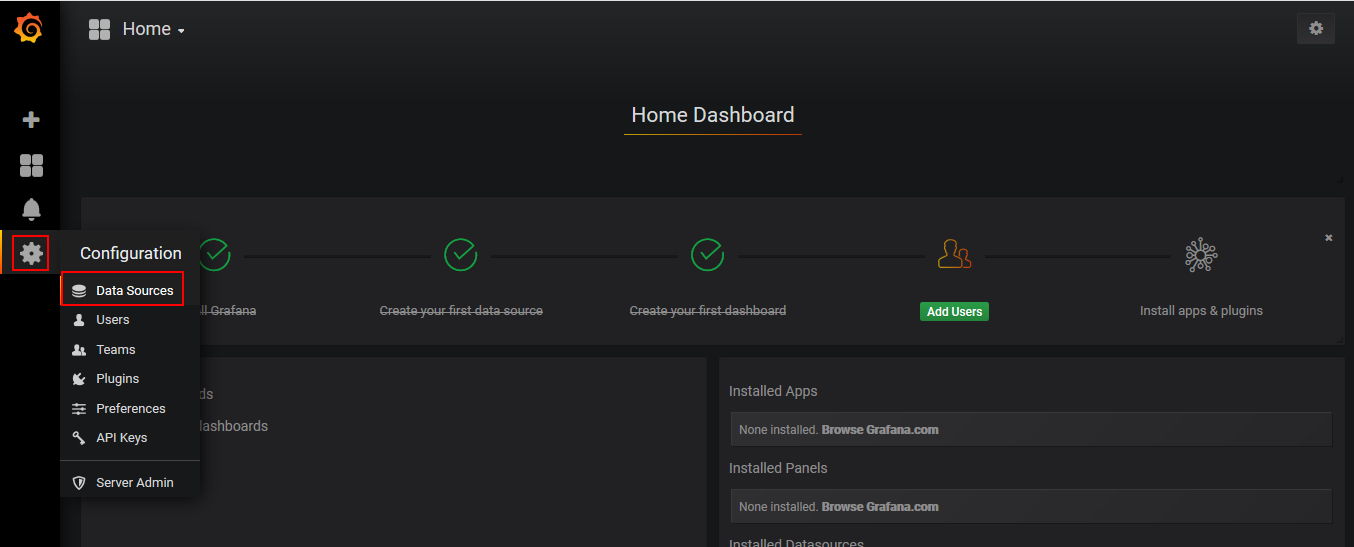
Configuration

data source configuration
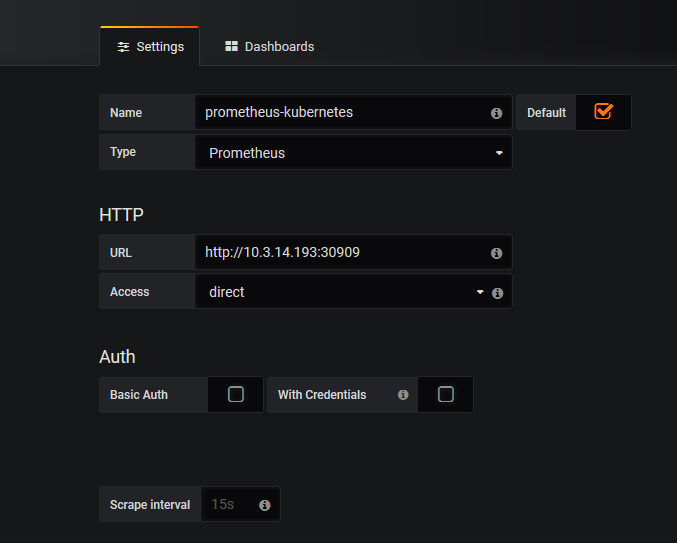
Prometheus
点击import
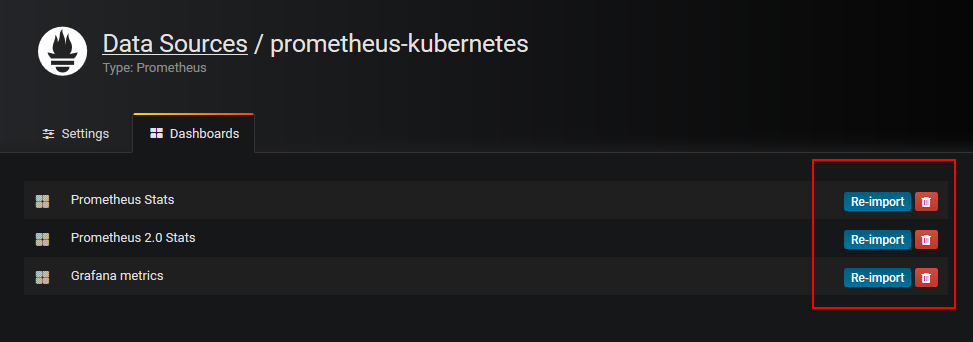
Grafana Dashboard
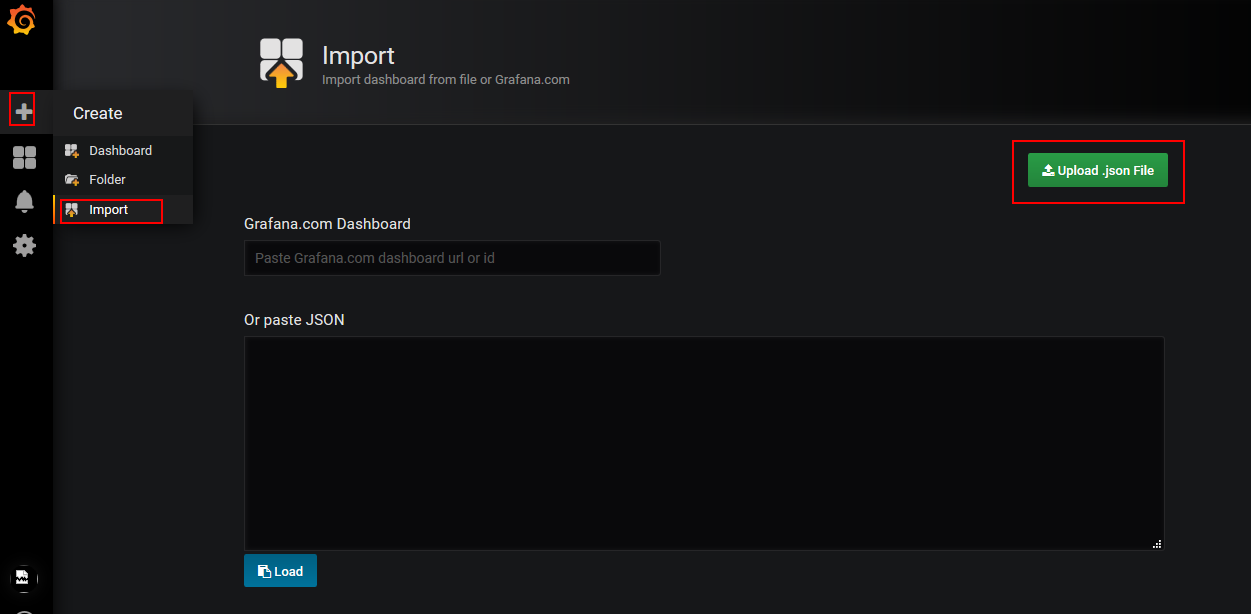
import
将JSON文件上传
grafana-dashboard.json
{
"__inputs": [
{
"name": "DS_PROMETHEUS",
"label": "prometheus",
"description": "",
"type": "datasource",
"pluginId": "prometheus",
"pluginName": "Prometheus"
}
],
"__requires": [
{
"type": "grafana",
"id": "grafana",
"name": "Grafana",
"version": "5.0.0"
},
{
"type": "panel",
"id": "graph",
"name": "Graph",
"version": "5.0.0"
},
{
"type": "datasource",
"id": "prometheus",
"name": "Prometheus",
"version": "5.0.0"
},
{
"type": "panel",
"id": "singlestat",
"name": "Singlestat",
"version": "5.0.0"
}
],
"annotations": {
"list": [
{
"builtIn": 1,
"datasource": "-- Grafana --",
"enable": true,
"hide": true,
"iconColor": "rgba(0, 211, 255, 1)",
"name": "Annotations & Alerts",
"type": "dashboard"
}
]
},
"description": "Shows resource usage of Kubernetes pods.",
"editable": true,
"gnetId": 737,
"graphTooltip": 0,
"id": null,
"iteration": 1524106098941,
"links": [],
"panels": [
{
"collapsed": false,
"gridPos": {
"h": 1,
"w": 24,
"x": 0,
"y": 0
},
"id": 35,
"panels": [],
"title": "all pods",
"type": "row"
},
{
"cacheTimeout": null,
"colorBackground": false,
"colorValue": true,
"colors": [
"rgba(50, 172, 45, 0.97)",
"rgba(237, 129, 40, 0.89)",
"rgba(245, 54, 54, 0.9)"
],
"datasource": "${DS_PROMETHEUS}",
"editable": true,
"error": false,
"format": "percent",
"gauge": {
"maxValue": 100,
"minValue": 0,
"show": true,
"thresholdLabels": false,
"thresholdMarkers": true
},
"gridPos": {
"h": 5,
"w": 8,
"x": 0,
"y": 1
},
"height": "180px",
"id": 4,
"interval": null,
"isNew": true,
"links": [],
"mappingType": 1,
"mappingTypes": [
{
"name": "value to text",
"value": 1
},
{
"name": "range to text",
"value": 2
}
],
"maxDataPoints": 100,
"nullPointMode": "connected",
"nullText": null,
"postfix": "",
"postfixFontSize": "50%",
"prefix": "",
"prefixFontSize": "50%",
"rangeMaps": [
{
"from": "null",
"text": "N/A",
"to": "null"
}
],
"sparkline": {
"fillColor": "rgba(31, 118, 189, 0.18)",
"full": false,
"lineColor": "rgb(31, 120, 193)",
"show": false
},
"tableColumn": "",
"targets": [
{
"expr": "sum (container_memory_working_set_bytes{id=\"/\",instance=~\"^$instance$\"}) / sum (machine_memory_bytes{instance=~\"^$instance$\"}) * 100",
"interval": "",
"intervalFactor": 2,
"legendFormat": "",
"refId": "A",
"step": 2
}
],
"thresholds": "65, 90",
"timeFrom": "1m",
"timeShift": null,
"title": "Memory Working Set",
"transparent": false,
"type": "singlestat",
"valueFontSize": "80%",
"valueMaps": [
{
"op": "=",
"text": "N/A",
"value": "null"
}
],
"valueName": "current"
},
{
"cacheTimeout": null,
"colorBackground": false,
"colorValue": true,
"colors": [
"rgba(50, 172, 45, 0.97)",
"rgba(237, 129, 40, 0.89)",
"rgba(245, 54, 54, 0.9)"
],
"datasource": "${DS_PROMETHEUS}",
"decimals": 2,
"editable": true,
"error": false,
"format": "percent",
"gauge": {
"maxValue": 100,
"minValue": 0,
"show": true,
"thresholdLabels": false,
"thresholdMarkers": true
},
"gridPos": {
"h": 5,
"w": 8,
"x": 8,
"y": 1
},
"height": "180px",
"id": 6,
"interval": null,
"isNew": true,
"links": [],
"mappingType": 1,
"mappingTypes": [
{
"name": "value to text",
"value": 1
},
{
"name": "range to text",
"value": 2
}
],
"maxDataPoints": 100,
"nullPointMode": "connected",
"nullText": null,
"postfix": "",
"postfixFontSize": "50%",
"prefix": "",
"prefixFontSize": "50%",
"rangeMaps": [
{
"from": "null",
"text": "N/A",
"to": "null"
}
],
"sparkline": {
"fillColor": "rgba(31, 118, 189, 0.18)",
"full": false,
"lineColor": "rgb(31, 120, 193)",
"show": false
},
"tableColumn": "",
"targets": [
{
"expr": "sum(rate(container_cpu_usage_seconds_total{id=\"/\",instance=~\"^$instance$\"}[1m])) / sum (machine_cpu_cores{instance=~\"^$instance$\"}) * 100",
"interval": "10s",
"intervalFactor": 1,
"refId": "A",
"step": 10
}
],
"thresholds": "65, 90",
"timeFrom": "1m",
"timeShift": null,
"title": "Cpu Usage",
"type": "singlestat",
"valueFontSize": "80%",
"valueMaps": [
{
"op": "=",
"text": "N/A",
"value": "null"
}
],
"valueName": "current"
},
{
"cacheTimeout": null,
"colorBackground": false,
"colorValue": true,
"colors": [
"rgba(50, 172, 45, 0.97)",
"rgba(237, 129, 40, 0.89)",
"rgba(245, 54, 54, 0.9)"
],
"datasource": "${DS_PROMETHEUS}",
"decimals": 2,
"editable": true,
"error": false,
"format": "percent",
"gauge": {
"maxValue": 100,
"minValue": 0,
"show": true,
"thresholdLabels": false,
"thresholdMarkers": true
},
"gridPos": {
"h": 5,
"w": 8,
"x": 16,
"y": 1
},
"height": "180px",
"id": 7,
"interval": null,
"isNew": true,
"links": [],
"mappingType": 1,
"mappingTypes": [
{
"name": "value to text",
"value": 1
},
{
"name": "range to text",
"value": 2
}
],
"maxDataPoints": 100,
"nullPointMode": "connected",
"nullText": null,
"postfix": "",
"postfixFontSize": "50%",
"prefix": "",
"prefixFontSize": "50%",
"rangeMaps": [
{
"from": "null",
"text": "N/A",
"to": "null"
}
],
"sparkline": {
"fillColor": "rgba(31, 118, 189, 0.18)",
"full": false,
"lineColor": "rgb(31, 120, 193)",
"show": false
},
"tableColumn": "",
"targets": [
{
"expr": "sum(container_fs_usage_bytes{id=\"/\",instance=~\"^$instance$\"}) / sum(container_fs_limit_bytes{id=\"/\",instance=~\"^$instance$\"}) * 100",
"interval": "10s",
"intervalFactor": 1,
"legendFormat": "",
"metric": "",
"refId": "A",
"step": 10
}
],
"thresholds": "65, 90",
"timeFrom": "1m",
"timeShift": null,
"title": "Filesystem Usage",
"type": "singlestat",
"valueFontSize": "80%",
"valueMaps": [
{
"op": "=",
"text": "N/A",
"value": "null"
}
],
"valueName": "current"
},
{
"cacheTimeout": null,
"colorBackground": false,
"colorValue": false,
"colors": [
"rgba(50, 172, 45, 0.97)",
"rgba(237, 129, 40, 0.89)",
"rgba(245, 54, 54, 0.9)"
],
"datasource": "${DS_PROMETHEUS}",
"decimals": 2,
"editable": true,
"error": false,
"format": "bytes",
"gauge": {
"maxValue": 100,
"minValue": 0,
"show": false,
"thresholdLabels": false,
"thresholdMarkers": true
},
"gridPos": {
"h": 3,
"w": 4,
"x": 0,
"y": 6
},
"height": "1px",
"hideTimeOverride": true,
"id": 9,
"interval": null,
"isNew": true,
"links": [],
"mappingType": 1,
"mappingTypes": [
{
"name": "value to text",
"value": 1
},
{
"name": "range to text",
"value": 2
}
],
"maxDataPoints": 100,
"nullPointMode": "connected",
"nullText": null,
"postfix": "",
"postfixFontSize": "20%",
"prefix": "",
"prefixFontSize": "20%",
"rangeMaps": [
{
"from": "null",
"text": "N/A",
"to": "null"
}
],
"sparkline": {
"fillColor": "rgba(31, 118, 189, 0.18)",
"full": false,
"lineColor": "rgb(31, 120, 193)",
"show": false
},
"tableColumn": "",
"targets": [
{
"expr": "sum(container_memory_working_set_bytes{id=\"/\",instance=~\"^$instance$\"})",
"interval": "10s",
"intervalFactor": 1,
"refId": "A",
"step": 10
}
],
"thresholds": "",
"timeFrom": "1m",
"title": "Used",
"type": "singlestat",
"valueFontSize": "50%",
"valueMaps": [
{
"op": "=",
"text": "N/A",
"value": "null"
}
],
"valueName": "current"
},
{
"cacheTimeout": null,
"colorBackground": false,
"colorValue": false,
"colors": [
"rgba(50, 172, 45, 0.97)",
"rgba(237, 129, 40, 0.89)",
"rgba(245, 54, 54, 0.9)"
],
"datasource": "${DS_PROMETHEUS}",
"decimals": 2,
"editable": true,
"error": false,
"format": "bytes",
"gauge": {
"maxValue": 100,
"minValue": 0,
"show": false,
"thresholdLabels": false,
"thresholdMarkers": true
},
"gridPos": {
"h": 3,
"w": 4,
"x": 4,
"y": 6
},
"height": "1px",
"hideTimeOverride": true,
"id": 10,
"interval": null,
"isNew": true,
"links": [],
"mappingType": 1,
"mappingTypes": [
{
"name": "value to text",
"value": 1
},
{
"name": "range to text",
"value": 2
}
],
"maxDataPoints": 100,
"nullPointMode": "connected",
"nullText": null,
"postfix": "",
"postfixFontSize": "50%",
"prefix": "",
"prefixFontSize": "50%",
"rangeMaps": [
{
"from": "null",
"text": "N/A",
"to": "null"
}
],
"sparkline": {
"fillColor": "rgba(31, 118, 189, 0.18)",
"full": false,
"lineColor": "rgb(31, 120, 193)",
"show": false
},
"tableColumn": "",
"targets": [
{
"expr": "sum (machine_memory_bytes{instance=~\"^$instance$\"})",
"interval": "10s",
"intervalFactor": 1,
"refId": "A",
"step": 10
}
],
"thresholds": "",
"timeFrom": "1m",
"title": "Total",
"type": "singlestat",
"valueFontSize": "50%",
"valueMaps": [
{
"op": "=",
"text": "N/A",
"value": "null"
}
],
"valueName": "current"
},
{
"cacheTimeout": null,
"colorBackground": false,
"colorValue": false,
"colors": [
"rgba(50, 172, 45, 0.97)",
"rgba(237, 129, 40, 0.89)",
"rgba(245, 54, 54, 0.9)"
],
"datasource": "${DS_PROMETHEUS}",
"decimals": 2,
"editable": true,
"error": false,
"format": "none",
"gauge": {
"maxValue": 100,
"minValue": 0,
"show": false,
"thresholdLabels": false,
"thresholdMarkers": true
},
"gridPos": {
"h": 3,
"w": 4,
"x": 8,
"y": 6
},
"height": "1px",
"hideTimeOverride": true,
"id": 11,
"interval": null,
"isNew": true,
"links": [],
"mappingType": 1,
"mappingTypes": [
{
"name": "value to text",
"value": 1
},
{
"name": "range to text",
"value": 2
}
],
"maxDataPoints": 100,
"nullPointMode": "connected",
"nullText": null,
"postfix": " cores",
"postfixFontSize": "30%",
"prefix": "",
"prefixFontSize": "50%",
"rangeMaps": [
{
"from": "null",
"text": "N/A",
"to": "null"
}
],
"sparkline": {
"fillColor": "rgba(31, 118, 189, 0.18)",
"full": false,
"lineColor": "rgb(31, 120, 193)",
"show": false
},
"tableColumn": "",
"targets": [
{
"expr": "sum (rate (container_cpu_usage_seconds_total{id=\"/\",instance=~\"^$instance$\"}[1m]))",
"interval": "10s",
"intervalFactor": 1,
"refId": "A",
"step": 10
}
],
"thresholds": "",
"timeFrom": "1m",
"timeShift": null,
"title": "Used",
"type": "singlestat",
"valueFontSize": "50%",
"valueMaps": [
{
"op": "=",
"text": "N/A",
"value": "null"
}
],
"valueName": "current"
},
{
"cacheTimeout": null,
"colorBackground": false,
"colorValue": false,
"colors": [
"rgba(50, 172, 45, 0.97)",
"rgba(237, 129, 40, 0.89)",
"rgba(245, 54, 54, 0.9)"
],
"datasource": "${DS_PROMETHEUS}",
"decimals": 2,
"editable": true,
"error": false,
"format": "none",
"gauge": {
"maxValue": 100,
"minValue": 0,
"show": false,
"thresholdLabels": false,
"thresholdMarkers": true
},
"gridPos": {
"h": 3,
"w": 4,
"x": 12,
"y": 6
},
"height": "1px",
"hideTimeOverride": true,
"id": 12,
"interval": null,
"isNew": true,
"links": [],
"mappingType": 1,
"mappingTypes": [
{
"name": "value to text",
"value": 1
},
{
"name": "range to text",
"value": 2
}
],
"maxDataPoints": 100,
"nullPointMode": "connected",
"nullText": null,
"postfix": " cores",
"postfixFontSize": "30%",
"prefix": "",
"prefixFontSize": "50%",
"rangeMaps": [
{
"from": "null",
"text": "N/A",
"to": "null"
}
],
"sparkline": {
"fillColor": "rgba(31, 118, 189, 0.18)",
"full": false,
"lineColor": "rgb(31, 120, 193)",
"show": false
},
"tableColumn": "",
"targets": [
{
"expr": "sum (machine_cpu_cores{instance=~\"^$instance$\"})",
"interval": "10s",
"intervalFactor": 1,
"refId": "A",
"step": 10
}
],
"thresholds": "",
"timeFrom": "1m",
"title": "Total",
"type": "singlestat",
"valueFontSize": "50%",
"valueMaps": [
{
"op": "=",
"text": "N/A",
"value": "null"
}
],
"valueName": "current"
},
{
"cacheTimeout": null,
"colorBackground": false,
"colorValue": false,
"colors": [
"rgba(50, 172, 45, 0.97)",
"rgba(237, 129, 40, 0.89)",
"rgba(245, 54, 54, 0.9)"
],
"datasource": "${DS_PROMETHEUS}",
"decimals": 2,
"editable": true,
"error": false,
"format": "bytes",
"gauge": {
"maxValue": 100,
"minValue": 0,
"show": false,
"thresholdLabels": false,
"thresholdMarkers": true
},
"gridPos": {
"h": 3,
"w": 4,
"x": 16,
"y": 6
},
"height": "1px",
"hideTimeOverride": true,
"id": 13,
"interval": null,
"isNew": true,
"links": [],
"mappingType": 1,
"mappingTypes": [
{
"name": "value to text",
"value": 1
},
{
"name": "range to text",
"value": 2
}
],
"maxDataPoints": 100,
"nullPointMode": "connected",
"nullText": null,
"postfix": "",
"postfixFontSize": "50%",
"prefix": "",
"prefixFontSize": "50%",
"rangeMaps": [
{
"from": "null",
"text": "N/A",
"to": "null"
}
],
"sparkline": {
"fillColor": "rgba(31, 118, 189, 0.18)",
"full": false,
"lineColor": "rgb(31, 120, 193)",
"show": false
},
"tableColumn": "",
"targets": [
{
"expr": "sum(container_fs_usage_bytes{id=\"/\",instance=~\"^$instance$\"})",
"interval": "10s",
"intervalFactor": 1,
"refId": "A",
"step": 10
}
],
"thresholds": "",
"timeFrom": "1m",
"title": "Used",
"type": "singlestat",
"valueFontSize": "50%",
"valueMaps": [
{
"op": "=",
"text": "N/A",
"value": "null"
}
],
"valueName": "current"
},
{
"cacheTimeout": null,
"colorBackground": false,
"colorValue": false,
"colors": [
"rgba(50, 172, 45, 0.97)",
"rgba(237, 129, 40, 0.89)",
"rgba(245, 54, 54, 0.9)"
],
"datasource": "${DS_PROMETHEUS}",
"decimals": 2,
"editable": true,
"error": false,
"format": "bytes",
"gauge": {
"maxValue": 100,
"minValue": 0,
"show": false,
"thresholdLabels": false,
"thresholdMarkers": true
},
"gridPos": {
"h": 3,
"w": 4,
"x": 20,
"y": 6
},
"height": "1px",
"hideTimeOverride": true,
"id": 14,
"interval": null,
"isNew": true,
"links": [],
"mappingType": 1,
"mappingTypes": [
{
"name": "value to text",
"value": 1
},
{
"name": "range to text",
"value": 2
}
],
"maxDataPoints": 100,
"nullPointMode": "connected",
"nullText": null,
"postfix": "",
"postfixFontSize": "50%",
"prefix": "",
"prefixFontSize": "50%",
"rangeMaps": [
{
"from": "null",
"text": "N/A",
"to": "null"
}
],
"sparkline": {
"fillColor": "rgba(31, 118, 189, 0.18)",
"full": false,
"lineColor": "rgb(31, 120, 193)",
"show": false
},
"tableColumn": "",
"targets": [
{
"expr": "sum (container_fs_limit_bytes{id=\"/\",instance=~\"^$instance$\"})",
"interval": "10s",
"intervalFactor": 1,
"refId": "A",
"step": 10
}
],
"thresholds": "",
"timeFrom": "1m",
"title": "Total",
"type": "singlestat",
"valueFontSize": "50%",
"valueMaps": [
{
"op": "=",
"text": "N/A",
"value": "null"
}
],
"valueName": "current"
},
{
"aliasColors": {},
"bars": false,
"dashLength": 10,
"dashes": false,
"datasource": "${DS_PROMETHEUS}",
"decimals": 2,
"editable": true,
"error": false,
"fill": 1,
"grid": {},
"gridPos": {
"h": 5,
"w": 24,
"x": 0,
"y": 9
},
"height": "200px",
"id": 32,
"isNew": true,
"legend": {
"alignAsTable": true,
"avg": true,
"current": true,
"max": false,
"min": false,
"rightSide": true,
"show": true,
"sideWidth": 200,
"sort": "current",
"sortDesc": true,
"total": false,
"values": true
},
"lines": true,
"linewidth": 2,
"links": [],
"nullPointMode": "connected",
"percentage": false,
"pointradius": 5,
"points": false,
"renderer": "flot",
"seriesOverrides": [],
"spaceLength": 10,
"stack": false,
"steppedLine": false,
"targets": [
{
"expr": "sum(rate(container_network_receive_bytes_total{instance=~\"^$instance$\",namespace=~\"^$namespace$\"}[1m]))",
"interval": "",
"intervalFactor": 2,
"legendFormat": "receive",
"metric": "network",
"refId": "A",
"step": 240
},
{
"expr": "- sum(rate(container_network_transmit_bytes_total{instance=~\"^$instance$\",namespace=~\"^$namespace$\"}[1m]))",
"interval": "",
"intervalFactor": 2,
"legendFormat": "transmit",
"metric": "network",
"refId": "B",
"step": 240
}
],
"thresholds": [],
"timeFrom": null,
"timeShift": null,
"title": "Network",
"tooltip": {
"msResolution": false,
"shared": true,
"sort": 0,
"value_type": "cumulative"
},
"transparent": false,
"type": "graph",
"xaxis": {
"buckets": null,
"mode": "time",
"name": null,
"show": true,
"values": []
},
"yaxes": [
{
"format": "Bps",
"label": "transmit / receive",
"logBase": 1,
"max": null,
"min": null,
"show": true
},
{
"format": "Bps",
"label": null,
"logBase": 1,
"max": null,
"min": null,
"show": false
}
]
},
{
"collapsed": false,
"gridPos": {
"h": 1,
"w": 24,
"x": 0,
"y": 14
},
"id": 36,
"panels": [],
"title": "each pod",
"type": "row"
},
{
"aliasColors": {},
"bars": false,
"dashLength": 10,
"dashes": false,
"datasource": "${DS_PROMETHEUS}",
"decimals": 3,
"editable": true,
"error": false,
"fill": 0,
"grid": {},
"gridPos": {
"h": 7,
"w": 24,
"x": 0,
"y": 15
},
"height": "",
"id": 17,
"isNew": true,
"legend": {
"alignAsTable": true,
"avg": true,
"current": true,
"hideEmpty": true,
"hideZero": true,
"max": false,
"min": false,
"rightSide": true,
"show": true,
"sideWidth": null,
"sort": "current",
"sortDesc": true,
"total": false,
"values": true
},
"lines": true,
"linewidth": 2,
"links": [],
"nullPointMode": "connected",
"percentage": false,
"pointradius": 5,
"points": false,
"renderer": "flot",
"seriesOverrides": [],
"spaceLength": 10,
"stack": false,
"steppedLine": false,
"targets": [
{
"expr": "sum(rate(container_cpu_usage_seconds_total{image!=\"\",name=~\"^k8s_.*\",instance=~\"^$instance$\",namespace=~\"^$namespace$\"}[1m])) by (pod_name)",
"interval": "",
"intervalFactor": 2,
"legendFormat": "{{ pod_name }}",
"metric": "container_cpu",
"refId": "A",
"step": 240
}
],
"thresholds": [],
"timeFrom": null,
"timeShift": null,
"title": "Cpu Usage",
"tooltip": {
"msResolution": true,
"shared": false,
"sort": 2,
"value_type": "cumulative"
},
"transparent": false,
"type": "graph",
"xaxis": {
"buckets": null,
"mode": "time",
"name": null,
"show": true,
"values": []
},
"yaxes": [
{
"format": "none",
"label": "cores",
"logBase": 1,
"max": null,
"min": null,
"show": true
},
{
"format": "short",
"label": null,
"logBase": 1,
"max": null,
"min": null,
"show": false
}
]
},
{
"aliasColors": {},
"bars": false,
"dashLength": 10,
"dashes": false,
"datasource": "${DS_PROMETHEUS}",
"decimals": 2,
"editable": true,
"error": false,
"fill": 0,
"grid": {},
"gridPos": {
"h": 7,
"w": 24,
"x": 0,
"y": 22
},
"id": 33,
"isNew": true,
"legend": {
"alignAsTable": true,
"avg": true,
"current": true,
"hideEmpty": true,
"hideZero": true,
"max": false,
"min": false,
"rightSide": true,
"show": true,
"sideWidth": null,
"sort": "current",
"sortDesc": true,
"total": false,
"values": true
},
"lines": true,
"linewidth": 2,
"links": [],
"nullPointMode": "null",
"percentage": false,
"pointradius": 5,
"points": false,
"renderer": "flot",
"seriesOverrides": [],
"spaceLength": 10,
"stack": false,
"steppedLine": false,
"targets": [
{
"expr": "sum (container_memory_working_set_bytes{image!=\"\",name=~\"^k8s_.*\",instance=~\"^$instance$\",namespace=~\"^$namespace$\"}) by (pod_name)",
"interval": "",
"intervalFactor": 2,
"legendFormat": "{{ pod_name }}",
"metric": "",
"refId": "A",
"step": 240
}
],
"thresholds": [],
"timeFrom": null,
"timeShift": null,
"title": "Memory Working Set",
"tooltip": {
"msResolution": false,
"shared": false,
"sort": 2,
"value_type": "cumulative"
},
"type": "graph",
"xaxis": {
"buckets": null,
"mode": "time",
"name": null,
"show": true,
"values": []
},
"yaxes": [
{
"format": "bytes",
"label": "used",
"logBase": 1,
"max": null,
"min": null,
"show": true
},
{
"format": "short",
"label": null,
"logBase": 1,
"max": null,
"min": null,
"show": false
}
]
},
{
"aliasColors": {},
"bars": false,
"dashLength": 10,
"dashes": false,
"datasource": "${DS_PROMETHEUS}",
"decimals": 2,
"editable": true,
"error": false,
"fill": 1,
"grid": {},
"gridPos": {
"h": 7,
"w": 24,
"x": 0,
"y": 29
},
"id": 16,
"isNew": true,
"legend": {
"alignAsTable": true,
"avg": true,
"current": true,
"hideEmpty": true,
"hideZero": true,
"max": false,
"min": false,
"rightSide": true,
"show": true,
"sideWidth": 200,
"sort": "avg",
"sortDesc": true,
"total": false,
"values": true
},
"lines": true,
"linewidth": 2,
"links": [],
"nullPointMode": "null",
"percentage": false,
"pointradius": 5,
"points": false,
"renderer": "flot",
"seriesOverrides": [],
"spaceLength": 10,
"stack": false,
"steppedLine": false,
"targets": [
{
"expr": "sum (rate (container_network_receive_bytes_total{image!=\"\",name=~\"^k8s_.*\",instance=~\"^$instance$\",namespace=~\"^$namespace$\"}[1m])) by (pod_name)",
"interval": "",
"intervalFactor": 2,
"legendFormat": "{{ pod_name }} < in",
"metric": "network",
"refId": "A",
"step": 240
},
{
"expr": "- sum (rate (container_network_transmit_bytes_total{image!=\"\",name=~\"^k8s_.*\",instance=~\"^$instance$\",namespace=~\"^$namespace$\"}[1m])) by (pod_name)",
"interval": "",
"intervalFactor": 2,
"legendFormat": "{{ pod_name }} > out",
"metric": "network",
"refId": "B",
"step": 240
}
],
"thresholds": [],
"timeFrom": null,
"timeShift": null,
"title": "Network",
"tooltip": {
"msResolution": false,
"shared": false,
"sort": 2,
"value_type": "cumulative"
},
"type": "graph",
"xaxis": {
"buckets": null,
"mode": "time",
"name": null,
"show": true,
"values": []
},
"yaxes": [
{
"format": "Bps",
"label": "transmit / receive",
"logBase": 1,
"max": null,
"min": null,
"show": true
},
{
"format": "short",
"label": null,
"logBase": 1,
"max": null,
"min": null,
"show": false
}
]
},
{
"aliasColors": {},
"bars": false,
"dashLength": 10,
"dashes": false,
"datasource": "${DS_PROMETHEUS}",
"decimals": 2,
"editable": true,
"error": false,
"fill": 1,
"grid": {},
"gridPos": {
"h": 7,
"w": 24,
"x": 0,
"y": 36
},
"id": 34,
"isNew": true,
"legend": {
"alignAsTable": true,
"avg": true,
"current": true,
"hideEmpty": true,
"hideZero": true,
"max": false,
"min": false,
"rightSide": true,
"show": true,
"sideWidth": 200,
"sort": "current",
"sortDesc": true,
"total": false,
"values": true
},
"lines": true,
"linewidth": 2,
"links": [],
"nullPointMode": "null",
"percentage": false,
"pointradius": 5,
"points": false,
"renderer": "flot",
"seriesOverrides": [],
"spaceLength": 10,
"stack": false,
"steppedLine": false,
"targets": [
{
"expr": "sum(container_fs_usage_bytes{image!=\"\",name=~\"^k8s_.*\",instance=~\"^$instance$\",namespace=~\"^$namespace$\"}) by (pod_name)",
"interval": "",
"intervalFactor": 2,
"legendFormat": "{{ pod_name }}",
"metric": "network",
"refId": "A",
"step": 240
}
],
"thresholds": [],
"timeFrom": null,
"timeShift": null,
"title": "Filesystem",
"tooltip": {
"msResolution": false,
"shared": false,
"sort": 2,
"value_type": "cumulative"
},
"type": "graph",
"xaxis": {
"buckets": null,
"mode": "time",
"name": null,
"show": true,
"values": []
},
"yaxes": [
{
"format": "bytes",
"label": "used",
"logBase": 1,
"max": null,
"min": null,
"show": true
},
{
"format": "short",
"label": null,
"logBase": 1,
"max": null,
"min": null,
"show": false
}
]
}
],
"refresh": false,
"schemaVersion": 16,
"style": "dark",
"tags": [
"kubernetes"
],
"templating": {
"list": [
{
"allValue": ".*",
"current": {},
"datasource": "${DS_PROMETHEUS}",
"hide": 0,
"includeAll": true,
"label": "Instance",
"multi": false,
"name": "instance",
"options": [],
"query": "label_values(instance)",
"refresh": 1,
"regex": "master|node.*",
"sort": 0,
"tagValuesQuery": "",
"tags": [],
"tagsQuery": "",
"type": "query",
"useTags": false
},
{
"allValue": null,
"current": {},
"datasource": "${DS_PROMETHEUS}",
"hide": 0,
"includeAll": true,
"label": "Namespace",
"multi": true,
"name": "namespace",
"options": [],
"query": "label_values(namespace)",
"refresh": 1,
"regex": "",
"sort": 0,
"tagValuesQuery": "",
"tags": [],
"tagsQuery": "",
"type": "query",
"useTags": false
}
]
},
"time": {
"from": "now-15m",
"to": "now"
},
"timepicker": {
"refresh_intervals": [
"5s",
"10s",
"30s",
"1m",
"5m",
"15m",
"30m",
"1h",
"2h",
"1d"
],
"time_options": [
"5m",
"15m",
"1h",
"6h",
"12h",
"24h",
"2d",
"7d",
"30d"
]
},
"timezone": "browser",
"title": "Kubernetes Pod Resources",
"uid": "Tl8II5Wmz",
"version": 19
}
然后点击导入
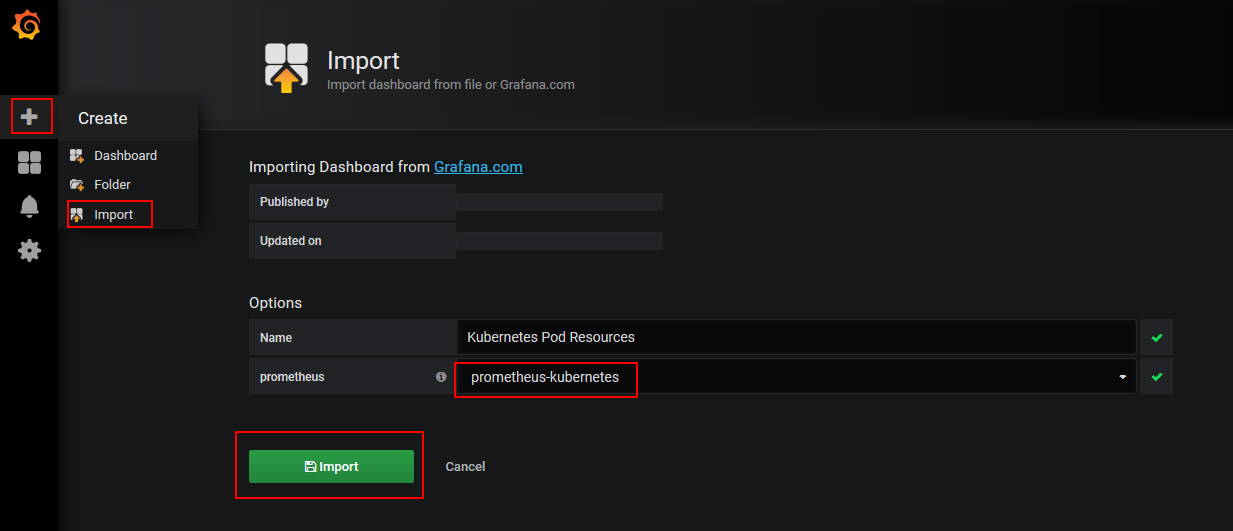
image.png
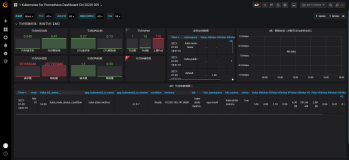
然后就可以看到Kubernetes集群的监控数据了
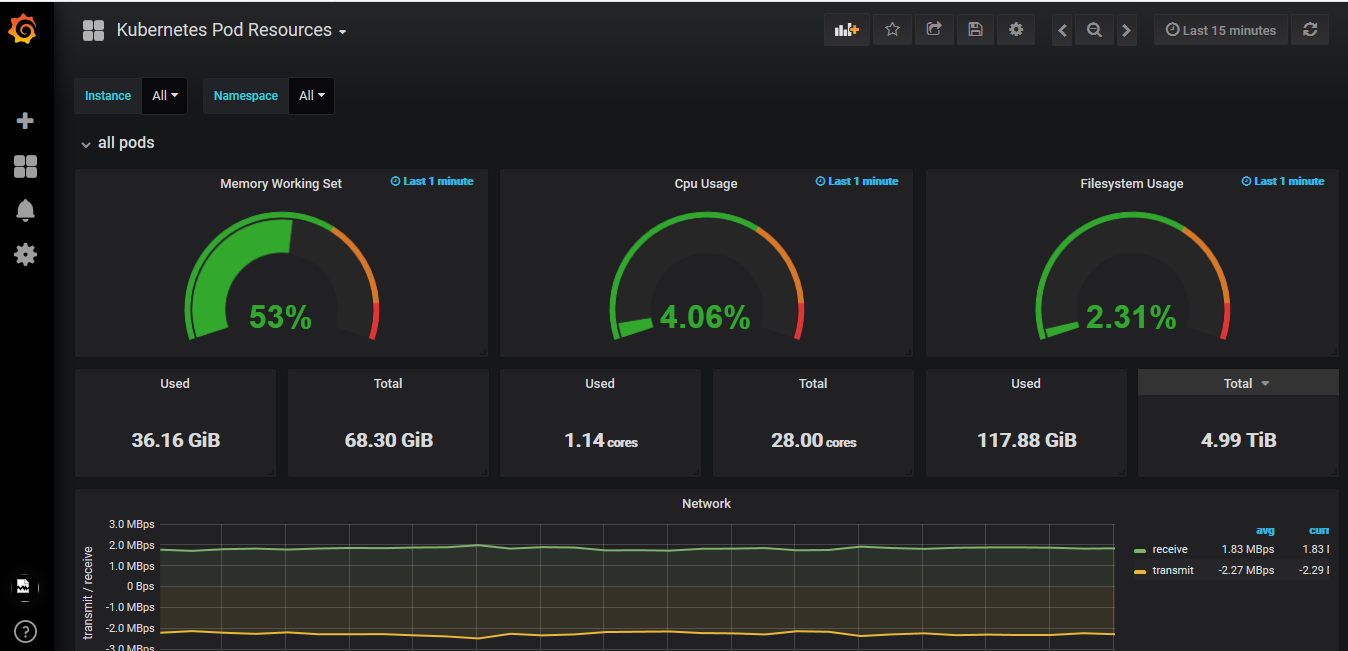
monitor dashboard
【附】还有其他的Dashboard
kubernetes-resources-usage-dashboard.json
{
"__inputs": [
{
"name": "DS_PROMETHEUS",
"label": "prometheus",
"description": "",
"type": "datasource",
"pluginId": "prometheus",
"pluginName": "Prometheus"
}
],
"__requires": [
{
"type": "panel",
"id": "graph",
"name": "Graph",
"version": ""
},
{
"type": "panel",
"id": "singlestat",
"name": "Singlestat",
"version": ""
},
{
"type": "grafana",
"id": "grafana",
"name": "Grafana",
"version": "3.1.1"
},
{
"type": "datasource",
"id": "prometheus",
"name": "Prometheus",
"version": "1.0.0"
}
],
"id": null,
"title": "Kubernetes resources usage monitoring (via Prometheus)",
"description": "Monitors Kubernetes cluster using Prometheus. Shows overall cluster CPU / Memory / Filesystem usage as well as individual pod, containers, systemd services statistics. Uses cAdvisor metrics only.",
"tags": [
"kubernetes"
],
"style": "dark",
"timezone": "browser",
"editable": true,
"hideControls": false,
"sharedCrosshair": false,
"rows": [
{
"collapse": false,
"editable": true,
"height": "200px",
"panels": [
{
"aliasColors": {},
"bars": false,
"datasource": "${DS_PROMETHEUS}",
"decimals": 3,
"editable": true,
"error": false,
"fill": 0,
"grid": {
"threshold1": null,
"threshold1Color": "rgba(216, 200, 27, 0.27)",
"threshold2": null,
"threshold2Color": "rgba(234, 112, 112, 0.22)"
},
"height": "",
"id": 34,
"isNew": true,
"legend": {
"alignAsTable": true,
"avg": true,
"current": true,
"max": false,
"min": false,
"rightSide": true,
"show": true,
"sort": "current",
"sortDesc": true,
"total": false,
"values": true
},
"lines": true,
"linewidth": 2,
"links": [],
"nullPointMode": "connected",
"percentage": false,
"pointradius": 5,
"points": false,
"renderer": "flot",
"seriesOverrides": [],
"span": 12,
"stack": false,
"steppedLine": false,
"targets": [
{
"expr": "(node_filesystem_size{mountpoint=\"/data-disk\"} - node_filesystem_free{mountpoint=\"/data-disk\"} ) / node_filesystem_size{mountpoint=\"/data-disk\"} * 100",
"interval": "10s",
"intervalFactor": 1,
"legendFormat": "{{ instance }}",
"metric": "",
"refId": "A",
"step": 10
}
],
"timeFrom": null,
"timeShift": null,
"title": "Nodes data disk usage",
"tooltip": {
"msResolution": true,
"shared": true,
"sort": 2,
"value_type": "cumulative"
},
"transparent": false,
"type": "graph",
"xaxis": {
"show": true
},
"yaxes": [
{
"format": "none",
"label": "cores",
"logBase": 1,
"max": null,
"min": null,
"show": true
},
{
"format": "short",
"label": null,
"logBase": 1,
"max": null,
"min": null,
"show": false
}
]
}
],
"title": "Network I/O pressure"
},
{
"collapse": false,
"editable": true,
"height": "250px",
"panels": [
{
"aliasColors": {},
"bars": false,
"datasource": "${DS_PROMETHEUS}",
"decimals": 3,
"editable": true,
"error": false,
"fill": 0,
"grid": {
"threshold1": null,
"threshold1Color": "rgba(216, 200, 27, 0.27)",
"threshold2": null,
"threshold2Color": "rgba(234, 112, 112, 0.22)"
},
"height": "",
"id": 33,
"isNew": true,
"legend": {
"alignAsTable": true,
"avg": true,
"current": true,
"max": false,
"min": false,
"rightSide": true,
"show": true,
"sort": "current",
"sortDesc": true,
"total": false,
"values": true
},
"lines": true,
"linewidth": 2,
"links": [],
"nullPointMode": "connected",
"percentage": false,
"pointradius": 5,
"points": false,
"renderer": "flot",
"seriesOverrides": [],
"span": 12,
"stack": false,
"steppedLine": false,
"targets": [
{
"expr": "(node_filesystem_size{mountpoint=\"/root-disk\"} - node_filesystem_free{mountpoint=\"/root-disk\"} ) / node_filesystem_size{mountpoint=\"/root-disk\"} * 100",
"interval": "10s",
"intervalFactor": 1,
"legendFormat": "{{ instance }}",
"metric": "",
"refId": "A",
"step": 10
}
],
"timeFrom": null,
"timeShift": null,
"title": "Nodes root disk usage",
"tooltip": {
"msResolution": true,
"shared": true,
"sort": 2,
"value_type": "cumulative"
},
"transparent": false,
"type": "graph",
"xaxis": {
"show": true
},
"yaxes": [
{
"format": "none",
"label": "cores",
"logBase": 1,
"max": null,
"min": null,
"show": true
},
{
"format": "short",
"label": null,
"logBase": 1,
"max": null,
"min": null,
"show": false
}
]
},
{
"aliasColors": {},
"bars": false,
"datasource": "${DS_PROMETHEUS}",
"decimals": 3,
"editable": true,
"error": false,
"fill": 0,
"grid": {
"threshold1": null,
"threshold1Color": "rgba(216, 200, 27, 0.27)",
"threshold2": null,
"threshold2Color": "rgba(234, 112, 112, 0.22)"
},
"height": "",
"id": 36,
"isNew": true,
"legend": {
"alignAsTable": true,
"avg": true,
"current": true,
"max": false,
"min": false,
"rightSide": true,
"show": true,
"sort": "current",
"sortDesc": true,
"total": false,
"values": true
},
"lines": true,
"linewidth": 2,
"links": [],
"nullPointMode": "connected",
"percentage": false,
"pointradius": 5,
"points": false,
"renderer": "flot",
"seriesOverrides": [],
"span": 12,
"stack": false,
"steppedLine": false,
"targets": [
{
"expr": "(((node_memory_MemTotal-node_memory_MemFree-node_memory_Cached)/(node_memory_MemTotal)*100))",
"interval": "10s",
"intervalFactor": 1,
"legendFormat": "{{ instance }}",
"metric": "node_cpu",
"refId": "A",
"step": 10
}
],
"timeFrom": null,
"timeShift": null,
"title": "Nodes Memory usage",
"tooltip": {
"msResolution": true,
"shared": true,
"sort": 2,
"value_type": "cumulative"
},
"transparent": false,
"type": "graph",
"xaxis": {
"show": true
},
"yaxes": [
{
"format": "none",
"label": "cores",
"logBase": 1,
"max": null,
"min": null,
"show": true
},
{
"format": "short",
"label": null,
"logBase": 1,
"max": null,
"min": null,
"show": false
}
]
},
{
"aliasColors": {},
"bars": false,
"datasource": "${DS_PROMETHEUS}",
"decimals": 3,
"editable": true,
"error": false,
"fill": 0,
"grid": {
"threshold1": null,
"threshold1Color": "rgba(216, 200, 27, 0.27)",
"threshold2": null,
"threshold2Color": "rgba(234, 112, 112, 0.22)"
},
"height": "",
"id": 17,
"isNew": true,
"legend": {
"alignAsTable": true,
"avg": true,
"current": true,
"max": false,
"min": false,
"rightSide": true,
"show": true,
"sort": "current",
"sortDesc": true,
"total": false,
"values": true
},
"lines": true,
"linewidth": 2,
"links": [],
"nullPointMode": "connected",
"percentage": false,
"pointradius": 5,
"points": false,
"renderer": "flot",
"seriesOverrides": [],
"span": 12,
"stack": false,
"steppedLine": false,
"targets": [
{
"expr": "(100 - (avg by (instance) (irate(node_cpu{name=\"node-exporter\",mode=\"idle\"}[5m])) * 100))",
"interval": "10s",
"intervalFactor": 1,
"legendFormat": "{{ instance }}",
"metric": "node_cpu",
"refId": "A",
"step": 10
}
],
"timeFrom": null,
"timeShift": null,
"title": "Nodes CPU usage",
"tooltip": {
"msResolution": true,
"shared": true,
"sort": 2,
"value_type": "cumulative"
},
"transparent": false,
"type": "graph",
"xaxis": {
"show": true
},
"yaxes": [
{
"format": "none",
"label": "cores",
"logBase": 1,
"max": null,
"min": null,
"show": true
},
{
"format": "short",
"label": null,
"logBase": 1,
"max": null,
"min": null,
"show": false
}
]
},
{
"aliasColors": {},
"bars": false,
"datasource": "${DS_PROMETHEUS}",
"decimals": 3,
"editable": true,
"error": false,
"fill": 0,
"grid": {
"threshold1": null,
"threshold1Color": "rgba(216, 200, 27, 0.27)",
"threshold2": null,
"threshold2Color": "rgba(234, 112, 112, 0.22)"
},
"height": "",
"id": 35,
"isNew": true,
"legend": {
"alignAsTable": true,
"avg": true,
"current": true,
"max": false,
"min": false,
"rightSide": true,
"show": true,
"sort": "current",
"sortDesc": true,
"total": false,
"values": true
},
"lines": true,
"linewidth": 2,
"links": [],
"nullPointMode": "connected",
"percentage": false,
"pointradius": 5,
"points": false,
"renderer": "flot",
"seriesOverrides": [],
"span": 12,
"stack": false,
"steppedLine": false,
"targets": [
{
"expr": "sum (rate (container_cpu_usage_seconds_total{image!=\"\",name=~\"^k8s_.*\",kubernetes_io_hostname=~\"^$Node$\"}[2m])) by (io_kubernetes_pod_name)",
"interval": "10s",
"intervalFactor": 1,
"legendFormat": "{{ io_kubernetes_pod_name }}",
"metric": "container_cpu",
"refId": "A",
"step": 10
}
],
"timeFrom": null,
"timeShift": null,
"title": "Pods CPU usage",
"tooltip": {
"msResolution": true,
"shared": true,
"sort": 2,
"value_type": "cumulative"
},
"transparent": false,
"type": "graph",
"xaxis": {
"show": true
},
"yaxes": [
{
"format": "none",
"label": "cores",
"logBase": 1,
"max": null,
"min": null,
"show": true
},
{
"format": "short",
"label": null,
"logBase": 1,
"max": null,
"min": null,
"show": false
}
]
},
{
"aliasColors": {},
"bars": false,
"datasource": "${DS_PROMETHEUS}",
"decimals": 2,
"editable": true,
"error": false,
"fill": 1,
"grid": {
"threshold1": null,
"threshold1Color": "rgba(216, 200, 27, 0.27)",
"threshold2": null,
"threshold2Color": "rgba(234, 112, 112, 0.22)",
"thresholdLine": false
},
"height": "200px",
"id": 32,
"isNew": true,
"legend": {
"alignAsTable": false,
"avg": true,
"current": true,
"max": false,
"min": false,
"rightSide": false,
"show": false,
"sideWidth": 200,
"sort": "current",
"sortDesc": true,
"total": false,
"values": true
},
"lines": true,
"linewidth": 2,
"links": [],
"nullPointMode": "connected",
"percentage": false,
"pointradius": 5,
"points": false,
"renderer": "flot",
"seriesOverrides": [],
"span": 12,
"stack": false,
"steppedLine": false,
"targets": [
{
"expr": "sum (rate (container_network_receive_bytes_total{kubernetes_io_hostname=~\"^$Node$\"}[2m]))",
"interval": "10s",
"intervalFactor": 1,
"legendFormat": "Received",
"metric": "network",
"refId": "A",
"step": 10
},
{
"expr": "- sum (rate (container_network_transmit_bytes_total{kubernetes_io_hostname=~\"^$Node$\"}[2m]))",
"interval": "10s",
"intervalFactor": 1,
"legendFormat": "Sent",
"metric": "network",
"refId": "B",
"step": 10
}
],
"timeFrom": null,
"timeShift": null,
"title": "Network I/O pressure",
"tooltip": {
"msResolution": false,
"shared": true,
"sort": 0,
"value_type": "cumulative"
},
"transparent": false,
"type": "graph",
"xaxis": {
"show": true
},
"yaxes": [
{
"format": "Bps",
"label": null,
"logBase": 1,
"max": null,
"min": null,
"show": true
},
{
"format": "Bps",
"label": null,
"logBase": 1,
"max": null,
"min": null,
"show": false
}
]
}
],
"showTitle": false,
"title": "Pods CPU usage"
},
{
"collapse": false,
"editable": true,
"height": "250px",
"panels": [
{
"cacheTimeout": null,
"colorBackground": false,
"colorValue": true,
"colors": [
"rgba(50, 172, 45, 0.97)",
"rgba(237, 129, 40, 0.89)",
"rgba(245, 54, 54, 0.9)"
],
"datasource": "${DS_PROMETHEUS}",
"editable": true,
"error": false,
"format": "percent",
"gauge": {
"maxValue": 100,
"minValue": 0,
"show": true,
"thresholdLabels": false,
"thresholdMarkers": true
},
"height": "180px",
"id": 4,
"interval": null,
"isNew": true,
"links": [],
"mappingType": 1,
"mappingTypes": [
{
"name": "value to text",
"value": 1
},
{
"name": "range to text",
"value": 2
}
],
"maxDataPoints": 100,
"nullPointMode": "connected",
"nullText": null,
"postfix": "",
"postfixFontSize": "50%",
"prefix": "",
"prefixFontSize": "50%",
"rangeMaps": [
{
"from": "null",
"text": "N/A",
"to": "null"
}
],
"span": 4,
"sparkline": {
"fillColor": "rgba(31, 118, 189, 0.18)",
"full": false,
"lineColor": "rgb(31, 120, 193)",
"show": false
},
"targets": [
{
"expr": "sum (container_memory_working_set_bytes{id=\"/\",kubernetes_io_hostname=~\"^$Node$\"}) / sum (machine_memory_bytes{kubernetes_io_hostname=~\"^$Node$\"}) * 100",
"interval": "10s",
"intervalFactor": 1,
"refId": "A",
"step": 10
}
],
"thresholds": "65, 90",
"title": "Cluster memory usage",
"transparent": false,
"type": "singlestat",
"valueFontSize": "80%",
"valueMaps": [
{
"op": "=",
"text": "N/A",
"value": "null"
}
],
"valueName": "current"
},
{
"cacheTimeout": null,
"colorBackground": false,
"colorValue": true,
"colors": [
"rgba(50, 172, 45, 0.97)",
"rgba(237, 129, 40, 0.89)",
"rgba(245, 54, 54, 0.9)"
],
"datasource": "${DS_PROMETHEUS}",
"decimals": 2,
"editable": true,
"error": false,
"format": "percent",
"gauge": {
"maxValue": 100,
"minValue": 0,
"show": true,
"thresholdLabels": false,
"thresholdMarkers": true
},
"height": "180px",
"id": 6,
"interval": null,
"isNew": true,
"links": [],
"mappingType": 1,
"mappingTypes": [
{
"name": "value to text",
"value": 1
},
{
"name": "range to text",
"value": 2
}
],
"maxDataPoints": 100,
"nullPointMode": "connected",
"nullText": null,
"postfix": "",
"postfixFontSize": "50%",
"prefix": "",
"prefixFontSize": "50%",
"rangeMaps": [
{
"from": "null",
"text": "N/A",
"to": "null"
}
],
"span": 4,
"sparkline": {
"fillColor": "rgba(31, 118, 189, 0.18)",
"full": false,
"lineColor": "rgb(31, 120, 193)",
"show": false
},
"targets": [
{
"expr": "sum (rate (container_cpu_usage_seconds_total{id=\"/\",kubernetes_io_hostname=~\"^$Node$\"}[2m])) / sum (machine_cpu_cores{kubernetes_io_hostname=~\"^$Node$\"}) * 100",
"interval": "10s",
"intervalFactor": 1,
"refId": "A",
"step": 10
}
],
"thresholds": "65, 90",
"title": "Cluster CPU usage",
"type": "singlestat",
"valueFontSize": "80%",
"valueMaps": [
{
"op": "=",
"text": "N/A",
"value": "null"
}
],
"valueName": "current"
},
{
"cacheTimeout": null,
"colorBackground": false,
"colorValue": true,
"colors": [
"rgba(50, 172, 45, 0.97)",
"rgba(237, 129, 40, 0.89)",
"rgba(245, 54, 54, 0.9)"
],
"datasource": "${DS_PROMETHEUS}",
"decimals": 2,
"editable": true,
"error": false,
"format": "percent",
"gauge": {
"maxValue": 100,
"minValue": 0,
"show": true,
"thresholdLabels": false,
"thresholdMarkers": true
},
"height": "180px",
"id": 7,
"interval": null,
"isNew": true,
"links": [],
"mappingType": 1,
"mappingTypes": [
{
"name": "value to text",
"value": 1
},
{
"name": "range to text",
"value": 2
}
],
"maxDataPoints": 100,
"nullPointMode": "connected",
"nullText": null,
"postfix": "",
"postfixFontSize": "50%",
"prefix": "",
"prefixFontSize": "50%",
"rangeMaps": [
{
"from": "null",
"text": "N/A",
"to": "null"
}
],
"span": 4,
"sparkline": {
"fillColor": "rgba(31, 118, 189, 0.18)",
"full": false,
"lineColor": "rgb(31, 120, 193)",
"show": false
},
"targets": [
{
"expr": "sum (container_fs_usage_bytes{device=\"/dev/mapper/vglocal20160809-root00\",id=\"/\",kubernetes_io_hostname=~\"^$Node$\"}) / sum (container_fs_limit_bytes{device=\"/dev/mapper/vglocal20160809-root00\",id=\"/\",kubernetes_io_hostname=~\"^$Node$\"}) * 100",
"interval": "10s",
"intervalFactor": 1,
"legendFormat": "",
"metric": "",
"refId": "A",
"step": 10
}
],
"thresholds": "65, 90",
"title": "Cluster filesystem usage",
"type": "singlestat",
"valueFontSize": "80%",
"valueMaps": [
{
"op": "=",
"text": "N/A",
"value": "null"
}
],
"valueName": "current"
},
{
"cacheTimeout": null,
"colorBackground": false,
"colorValue": false,
"colors": [
"rgba(50, 172, 45, 0.97)",
"rgba(237, 129, 40, 0.89)",
"rgba(245, 54, 54, 0.9)"
],
"datasource": "${DS_PROMETHEUS}",
"decimals": 2,
"editable": true,
"error": false,
"format": "bytes",
"gauge": {
"maxValue": 100,
"minValue": 0,
"show": false,
"thresholdLabels": false,
"thresholdMarkers": true
},
"height": "1px",
"id": 9,
"interval": null,
"isNew": true,
"links": [],
"mappingType": 1,
"mappingTypes": [
{
"name": "value to text",
"value": 1
},
{
"name": "range to text",
"value": 2
}
],
"maxDataPoints": 100,
"nullPointMode": "connected",
"nullText": null,
"postfix": "",
"postfixFontSize": "20%",
"prefix": "",
"prefixFontSize": "20%",
"rangeMaps": [
{
"from": "null",
"text": "N/A",
"to": "null"
}
],
"span": 2,
"sparkline": {
"fillColor": "rgba(31, 118, 189, 0.18)",
"full": false,
"lineColor": "rgb(31, 120, 193)",
"show": false
},
"targets": [
{
"expr": "sum (container_memory_working_set_bytes{id=\"/\",kubernetes_io_hostname=~\"^$Node$\"})",
"interval": "10s",
"intervalFactor": 1,
"refId": "A",
"step": 10
}
],
"thresholds": "",
"title": "Used",
"type": "singlestat",
"valueFontSize": "50%",
"valueMaps": [
{
"op": "=",
"text": "N/A",
"value": "null"
}
],
"valueName": "current"
},
{
"cacheTimeout": null,
"colorBackground": false,
"colorValue": false,
"colors": [
"rgba(50, 172, 45, 0.97)",
"rgba(237, 129, 40, 0.89)",
"rgba(245, 54, 54, 0.9)"
],
"datasource": "${DS_PROMETHEUS}",
"decimals": 2,
"editable": true,
"error": false,
"format": "bytes",
"gauge": {
"maxValue": 100,
"minValue": 0,
"show": false,
"thresholdLabels": false,
"thresholdMarkers": true
},
"height": "1px",
"id": 10,
"interval": null,
"isNew": true,
"links": [],
"mappingType": 1,
"mappingTypes": [
{
"name": "value to text",
"value": 1
},
{
"name": "range to text",
"value": 2
}
],
"maxDataPoints": 100,
"nullPointMode": "connected",
"nullText": null,
"postfix": "",
"postfixFontSize": "50%",
"prefix": "",
"prefixFontSize": "50%",
"rangeMaps": [
{
"from": "null",
"text": "N/A",
"to": "null"
}
],
"span": 2,
"sparkline": {
"fillColor": "rgba(31, 118, 189, 0.18)",
"full": false,
"lineColor": "rgb(31, 120, 193)",
"show": false
},
"targets": [
{
"expr": "sum (machine_memory_bytes{kubernetes_io_hostname=~\"^$Node$\"})",
"interval": "10s",
"intervalFactor": 1,
"refId": "A",
"step": 10
}
],
"thresholds": "",
"title": "Total",
"type": "singlestat",
"valueFontSize": "50%",
"valueMaps": [
{
"op": "=",
"text": "N/A",
"value": "null"
}
],
"valueName": "current"
},
{
"cacheTimeout": null,
"colorBackground": false,
"colorValue": false,
"colors": [
"rgba(50, 172, 45, 0.97)",
"rgba(237, 129, 40, 0.89)",
"rgba(245, 54, 54, 0.9)"
],
"datasource": "${DS_PROMETHEUS}",
"decimals": 2,
"editable": true,
"error": false,
"format": "none",
"gauge": {
"maxValue": 100,
"minValue": 0,
"show": false,
"thresholdLabels": false,
"thresholdMarkers": true
},
"height": "1px",
"id": 11,
"interval": null,
"isNew": true,
"links": [],
"mappingType": 1,
"mappingTypes": [
{
"name": "value to text",
"value": 1
},
{
"name": "range to text",
"value": 2
}
],
"maxDataPoints": 100,
"nullPointMode": "connected",
"nullText": null,
"postfix": " cores",
"postfixFontSize": "30%",
"prefix": "",
"prefixFontSize": "50%",
"rangeMaps": [
{
"from": "null",
"text": "N/A",
"to": "null"
}
],
"span": 2,
"sparkline": {
"fillColor": "rgba(31, 118, 189, 0.18)",
"full": false,
"lineColor": "rgb(31, 120, 193)",
"show": false
},
"targets": [
{
"expr": "sum (rate (container_cpu_usage_seconds_total{id=\"/\",kubernetes_io_hostname=~\"^$Node$\"}[2m]))",
"interval": "1m",
"intervalFactor": 1,
"refId": "A",
"step": 60
}
],
"thresholds": "",
"title": "Used",
"type": "singlestat",
"valueFontSize": "50%",
"valueMaps": [
{
"op": "=",
"text": "N/A",
"value": "null"
}
],
"valueName": "current"
},
{
"cacheTimeout": null,
"colorBackground": false,
"colorValue": false,
"colors": [
"rgba(50, 172, 45, 0.97)",
"rgba(237, 129, 40, 0.89)",
"rgba(245, 54, 54, 0.9)"
],
"datasource": "${DS_PROMETHEUS}",
"decimals": 2,
"editable": true,
"error": false,
"format": "none",
"gauge": {
"maxValue": 100,
"minValue": 0,
"show": false,
"thresholdLabels": false,
"thresholdMarkers": true
},
"height": "1px",
"id": 12,
"interval": null,
"isNew": true,
"links": [],
"mappingType": 1,
"mappingTypes": [
{
"name": "value to text",
"value": 1
},
{
"name": "range to text",
"value": 2
}
],
"maxDataPoints": 100,
"nullPointMode": "connected",
"nullText": null,
"postfix": " cores",
"postfixFontSize": "30%",
"prefix": "",
"prefixFontSize": "50%",
"rangeMaps": [
{
"from": "null",
"text": "N/A",
"to": "null"
}
],
"span": 2,
"sparkline": {
"fillColor": "rgba(31, 118, 189, 0.18)",
"full": false,
"lineColor": "rgb(31, 120, 193)",
"show": false
},
"targets": [
{
"expr": "sum (machine_cpu_cores{kubernetes_io_hostname=~\"^$Node$\"})",
"interval": "10s",
"intervalFactor": 1,
"refId": "A",
"step": 10
}
],
"thresholds": "",
"title": "Total",
"type": "singlestat",
"valueFontSize": "50%",
"valueMaps": [
{
"op": "=",
"text": "N/A",
"value": "null"
}
],
"valueName": "current"
},
{
"cacheTimeout": null,
"colorBackground": false,
"colorValue": false,
"colors": [
"rgba(50, 172, 45, 0.97)",
"rgba(237, 129, 40, 0.89)",
"rgba(245, 54, 54, 0.9)"
],
"datasource": "${DS_PROMETHEUS}",
"decimals": 2,
"editable": true,
"error": false,
"format": "bytes",
"gauge": {
"maxValue": 100,
"minValue": 0,
"show": false,
"thresholdLabels": false,
"thresholdMarkers": true
},
"height": "1px",
"id": 13,
"interval": null,
"isNew": true,
"links": [],
"mappingType": 1,
"mappingTypes": [
{
"name": "value to text",
"value": 1
},
{
"name": "range to text",
"value": 2
}
],
"maxDataPoints": 100,
"nullPointMode": "connected",
"nullText": null,
"postfix": "",
"postfixFontSize": "50%",
"prefix": "",
"prefixFontSize": "50%",
"rangeMaps": [
{
"from": "null",
"text": "N/A",
"to": "null"
}
],
"span": 2,
"sparkline": {
"fillColor": "rgba(31, 118, 189, 0.18)",
"full": false,
"lineColor": "rgb(31, 120, 193)",
"show": false
},
"targets": [
{
"expr": "sum (container_fs_usage_bytes{device=\"/dev/mapper/vglocal20160809-root00\",id=\"/\",kubernetes_io_hostname=~\"^$Node$\"})",
"interval": "10s",
"intervalFactor": 1,
"refId": "A",
"step": 10
}
],
"thresholds": "",
"title": "Used",
"type": "singlestat",
"valueFontSize": "50%",
"valueMaps": [
{
"op": "=",
"text": "N/A",
"value": "null"
}
],
"valueName": "current"
},
{
"cacheTimeout": null,
"colorBackground": false,
"colorValue": false,
"colors": [
"rgba(50, 172, 45, 0.97)",
"rgba(237, 129, 40, 0.89)",
"rgba(245, 54, 54, 0.9)"
],
"datasource": "${DS_PROMETHEUS}",
"decimals": 2,
"editable": true,
"error": false,
"format": "bytes",
"gauge": {
"maxValue": 100,
"minValue": 0,
"show": false,
"thresholdLabels": false,
"thresholdMarkers": true
},
"height": "1px",
"id": 14,
"interval": null,
"isNew": true,
"links": [],
"mappingType": 1,
"mappingTypes": [
{
"name": "value to text",
"value": 1
},
{
"name": "range to text",
"value": 2
}
],
"maxDataPoints": 100,
"nullPointMode": "connected",
"nullText": null,
"postfix": "",
"postfixFontSize": "50%",
"prefix": "",
"prefixFontSize": "50%",
"rangeMaps": [
{
"from": "null",
"text": "N/A",
"to": "null"
}
],
"span": 2,
"sparkline": {
"fillColor": "rgba(31, 118, 189, 0.18)",
"full": false,
"lineColor": "rgb(31, 120, 193)",
"show": false
},
"targets": [
{
"expr": "sum (container_fs_limit_bytes{device=\"/dev/mapper/vglocal20160809-root00\",id=\"/\",kubernetes_io_hostname=~\"^$Node$\"})",
"interval": "10s",
"intervalFactor": 1,
"refId": "A",
"step": 10
}
],
"thresholds": "",
"title": "Total",
"type": "singlestat",
"valueFontSize": "50%",
"valueMaps": [
{
"op": "=",
"text": "N/A",
"value": "null"
}
],
"valueName": "current"
}
],
"showTitle": false,
"title": "Total usage"
},
{
"collapse": true,
"editable": true,
"height": "250px",
"panels": [
{
"aliasColors": {},
"bars": false,
"datasource": "${DS_PROMETHEUS}",
"decimals": 3,
"editable": true,
"error": false,
"fill": 0,
"grid": {
"threshold1": null,
"threshold1Color": "rgba(216, 200, 27, 0.27)",
"threshold2": null,
"threshold2Color": "rgba(234, 112, 112, 0.22)"
},
"height": "",
"id": 23,
"isNew": true,
"legend": {
"alignAsTable": true,
"avg": true,
"current": true,
"max": false,
"min": false,
"rightSide": true,
"show": true,
"sort": "current",
"sortDesc": true,
"total": false,
"values": true
},
"lines": true,
"linewidth": 2,
"links": [],
"nullPointMode": "connected",
"percentage": false,
"pointradius": 5,
"points": false,
"renderer": "flot",
"seriesOverrides": [],
"span": 12,
"stack": false,
"steppedLine": false,
"targets": [
{
"expr": "sum (rate (container_cpu_usage_seconds_total{systemd_service_name!=\"\",kubernetes_io_hostname=~\"^$Node$\"}[2m])) by (systemd_service_name)",
"hide": false,
"interval": "10s",
"intervalFactor": 1,
"legendFormat": "{{ systemd_service_name }}",
"metric": "container_cpu",
"refId": "A",
"step": 10
}
],
"timeFrom": null,
"timeShift": null,
"title": "System services CPU usage",
"tooltip": {
"msResolution": true,
"shared": true,
"sort": 2,
"value_type": "cumulative"
},
"type": "graph",
"xaxis": {
"show": true
},
"yaxes": [
{
"format": "none",
"label": "cores",
"logBase": 1,
"max": null,
"min": null,
"show": true
},
{
"format": "short",
"label": null,
"logBase": 1,
"max": null,
"min": null,
"show": false
}
]
}
],
"title": "System services CPU usage"
},
{
"collapse": false,
"editable": true,
"height": "250px",
"panels": [
{
"aliasColors": {},
"bars": false,
"datasource": "${DS_PROMETHEUS}",
"decimals": 3,
"editable": true,
"error": false,
"fill": 0,
"grid": {
"threshold1": null,
"threshold1Color": "rgba(216, 200, 27, 0.27)",
"threshold2": null,
"threshold2Color": "rgba(234, 112, 112, 0.22)"
},
"height": "",
"id": 24,
"isNew": true,
"legend": {
"alignAsTable": true,
"avg": true,
"current": true,
"hideEmpty": false,
"hideZero": false,
"max": false,
"min": false,
"rightSide": true,
"show": true,
"sideWidth": null,
"sort": "current",
"sortDesc": true,
"total": false,
"values": true
},
"lines": true,
"linewidth": 2,
"links": [],
"nullPointMode": "connected",
"percentage": false,
"pointradius": 5,
"points": false,
"renderer": "flot",
"seriesOverrides": [],
"span": 12,
"stack": false,
"steppedLine": false,
"targets": [
{
"expr": "sum (rate (container_cpu_usage_seconds_total{image!=\"\",name=~\"^k8s_.*\",io_kubernetes_container_name!=\"POD\",kubernetes_io_hostname=~\"^$Node$\"}[2m])) by (io_kubernetes_container_name, io_kubernetes_pod_name)",
"hide": false,
"interval": "10s",
"intervalFactor": 1,
"legendFormat": "pod: {{ io_kubernetes_pod_name }} | {{ io_kubernetes_container_name }}",
"metric": "container_cpu",
"refId": "A",
"step": 10
},
{
"expr": "sum (rate (container_cpu_usage_seconds_total{image!=\"\",name!~\"^k8s_.*\",kubernetes_io_hostname=~\"^$Node$\"}[2m])) by (kubernetes_io_hostname, name, image)",
"hide": false,
"interval": "10s",
"intervalFactor": 1,
"legendFormat": "docker: {{ kubernetes_io_hostname }} | {{ image }} ({{ name }})",
"metric": "container_cpu",
"refId": "B",
"step": 10
},
{
"expr": "sum (rate (container_cpu_usage_seconds_total{rkt_container_name!=\"\",kubernetes_io_hostname=~\"^$Node$\"}[2m])) by (kubernetes_io_hostname, rkt_container_name)",
"interval": "10s",
"intervalFactor": 1,
"legendFormat": "rkt: {{ kubernetes_io_hostname }} | {{ rkt_container_name }}",
"metric": "container_cpu",
"refId": "C",
"step": 10
}
],
"timeFrom": null,
"timeShift": null,
"title": "Containers CPU usage",
"tooltip": {
"msResolution": true,
"shared": true,
"sort": 2,
"value_type": "cumulative"
},
"type": "graph",
"xaxis": {
"show": true
},
"yaxes": [
{
"format": "none",
"label": "cores",
"logBase": 1,
"max": null,
"min": null,
"show": true
},
{
"format": "short",
"label": null,
"logBase": 1,
"max": null,
"min": null,
"show": false
}
]
}
],
"title": "Containers CPU usage"
},
{
"collapse": false,
"editable": true,
"height": "500px",
"panels": [
{
"aliasColors": {},
"bars": false,
"datasource": "${DS_PROMETHEUS}",
"decimals": 3,
"editable": true,
"error": false,
"fill": 0,
"grid": {
"threshold1": null,
"threshold1Color": "rgba(216, 200, 27, 0.27)",
"threshold2": null,
"threshold2Color": "rgba(234, 112, 112, 0.22)"
},
"id": 20,
"isNew": true,
"legend": {
"alignAsTable": true,
"avg": true,
"current": true,
"max": false,
"min": false,
"rightSide": false,
"show": true,
"sort": "current",
"sortDesc": true,
"total": false,
"values": true
},
"lines": true,
"linewidth": 2,
"links": [],
"nullPointMode": "connected",
"percentage": false,
"pointradius": 5,
"points": false,
"renderer": "flot",
"seriesOverrides": [],
"span": 12,
"stack": false,
"steppedLine": false,
"targets": [
{
"expr": "sum (rate (container_cpu_usage_seconds_total{id!=\"/\",kubernetes_io_hostname=~\"^$Node$\"}[2m])) by (id)",
"hide": false,
"interval": "10s",
"intervalFactor": 1,
"legendFormat": "{{ id }}",
"metric": "container_cpu",
"refId": "A",
"step": 10
}
],
"timeFrom": null,
"timeShift": null,
"title": "All processes CPU usage",
"tooltip": {
"msResolution": true,
"shared": true,
"sort": 2,
"value_type": "cumulative"
},
"type": "graph",
"xaxis": {
"show": true
},
"yaxes": [
{
"format": "percent",
"label": null,
"logBase": 1,
"max": null,
"min": null,
"show": true
},
{
"format": "short",
"label": null,
"logBase": 1,
"max": null,
"min": null,
"show": false
}
]
}
],
"repeat": null,
"showTitle": false,
"title": "All processes CPU usage"
},
{
"collapse": false,
"editable": true,
"height": "250px",
"panels": [
{
"aliasColors": {},
"bars": false,
"datasource": "${DS_PROMETHEUS}",
"decimals": 2,
"editable": true,
"error": false,
"fill": 0,
"grid": {
"threshold1": null,
"threshold1Color": "rgba(216, 200, 27, 0.27)",
"threshold2": null,
"threshold2Color": "rgba(234, 112, 112, 0.22)"
},
"id": 25,
"isNew": true,
"legend": {
"alignAsTable": true,
"avg": true,
"current": true,
"max": false,
"min": false,
"rightSide": true,
"show": true,
"sideWidth": 200,
"sort": "current",
"sortDesc": true,
"total": false,
"values": true
},
"lines": true,
"linewidth": 2,
"links": [],
"nullPointMode": "connected",
"percentage": false,
"pointradius": 5,
"points": false,
"renderer": "flot",
"seriesOverrides": [],
"span": 12,
"stack": false,
"steppedLine": false,
"targets": [
{
"expr": "sum (container_memory_working_set_bytes{image!=\"\",name=~\"^k8s_.*\",kubernetes_io_hostname=~\"^$Node$\"}) by (io_kubernetes_pod_name)",
"interval": "10s",
"intervalFactor": 1,
"legendFormat": "{{ io_kubernetes_pod_name }}",
"metric": "container_memory_usage:sort_desc",
"refId": "A",
"step": 10
}
],
"timeFrom": null,
"timeShift": null,
"title": "Pods memory usage",
"tooltip": {
"msResolution": false,
"shared": true,
"sort": 2,
"value_type": "cumulative"
},
"type": "graph",
"xaxis": {
"show": true
},
"yaxes": [
{
"format": "bytes",
"label": null,
"logBase": 1,
"max": null,
"min": null,
"show": true
},
{
"format": "short",
"label": null,
"logBase": 1,
"max": null,
"min": null,
"show": false
}
]
}
],
"title": "Pods memory usage"
},
{
"collapse": false,
"editable": true,
"height": "250px",
"panels": [
{
"aliasColors": {},
"bars": false,
"datasource": "${DS_PROMETHEUS}",
"decimals": 2,
"editable": true,
"error": false,
"fill": 0,
"grid": {
"threshold1": null,
"threshold1Color": "rgba(216, 200, 27, 0.27)",
"threshold2": null,
"threshold2Color": "rgba(234, 112, 112, 0.22)"
},
"id": 26,
"isNew": true,
"legend": {
"alignAsTable": true,
"avg": true,
"current": true,
"max": false,
"min": false,
"rightSide": true,
"show": true,
"sideWidth": 200,
"sort": "current",
"sortDesc": true,
"total": false,
"values": true
},
"lines": true,
"linewidth": 2,
"links": [],
"nullPointMode": "connected",
"percentage": false,
"pointradius": 5,
"points": false,
"renderer": "flot",
"seriesOverrides": [],
"span": 12,
"stack": false,
"steppedLine": false,
"targets": [
{
"expr": "sum (container_memory_working_set_bytes{systemd_service_name!=\"\",kubernetes_io_hostname=~\"^$Node$\"}) by (systemd_service_name)",
"interval": "10s",
"intervalFactor": 1,
"legendFormat": "{{ systemd_service_name }}",
"metric": "container_memory_usage:sort_desc",
"refId": "A",
"step": 10
}
],
"timeFrom": null,
"timeShift": null,
"title": "System services memory usage",
"tooltip": {
"msResolution": false,
"shared": true,
"sort": 2,
"value_type": "cumulative"
},
"type": "graph",
"xaxis": {
"show": true
},
"yaxes": [
{
"format": "bytes",
"label": null,
"logBase": 1,
"max": null,
"min": null,
"show": true
},
{
"format": "short",
"label": null,
"logBase": 1,
"max": null,
"min": null,
"show": false
}
]
}
],
"title": "System services memory usage"
},
{
"collapse": true,
"editable": true,
"height": "250px",
"panels": [
{
"aliasColors": {},
"bars": false,
"datasource": "${DS_PROMETHEUS}",
"decimals": 2,
"editable": true,
"error": false,
"fill": 0,
"grid": {
"threshold1": null,
"threshold1Color": "rgba(216, 200, 27, 0.27)",
"threshold2": null,
"threshold2Color": "rgba(234, 112, 112, 0.22)"
},
"id": 27,
"isNew": true,
"legend": {
"alignAsTable": true,
"avg": true,
"current": true,
"max": false,
"min": false,
"rightSide": true,
"show": true,
"sideWidth": 200,
"sort": "current",
"sortDesc": true,
"total": false,
"values": true
},
"lines": true,
"linewidth": 2,
"links": [],
"nullPointMode": "connected",
"percentage": false,
"pointradius": 5,
"points": false,
"renderer": "flot",
"seriesOverrides": [],
"span": 12,
"stack": false,
"steppedLine": false,
"targets": [
{
"expr": "sum (container_memory_working_set_bytes{image!=\"\",name=~\"^k8s_.*\",io_kubernetes_container_name!=\"POD\",kubernetes_io_hostname=~\"^$Node$\"}) by (io_kubernetes_container_name, io_kubernetes_pod_name)",
"interval": "10s",
"intervalFactor": 1,
"legendFormat": "pod: {{ io_kubernetes_pod_name }} | {{ io_kubernetes_container_name }}",
"metric": "container_memory_usage:sort_desc",
"refId": "A",
"step": 10
},
{
"expr": "sum (container_memory_working_set_bytes{image!=\"\",name!~\"^k8s_.*\",kubernetes_io_hostname=~\"^$Node$\"}) by (kubernetes_io_hostname, name, image)",
"interval": "10s",
"intervalFactor": 1,
"legendFormat": "docker: {{ kubernetes_io_hostname }} | {{ image }} ({{ name }})",
"metric": "container_memory_usage:sort_desc",
"refId": "B",
"step": 10
},
{
"expr": "sum (container_memory_working_set_bytes{rkt_container_name!=\"\",kubernetes_io_hostname=~\"^$Node$\"}) by (kubernetes_io_hostname, rkt_container_name)",
"interval": "10s",
"intervalFactor": 1,
"legendFormat": "rkt: {{ kubernetes_io_hostname }} | {{ rkt_container_name }}",
"metric": "container_memory_usage:sort_desc",
"refId": "C",
"step": 10
}
],
"timeFrom": null,
"timeShift": null,
"title": "Containers memory usage",
"tooltip": {
"msResolution": false,
"shared": true,
"sort": 2,
"value_type": "cumulative"
},
"type": "graph",
"xaxis": {
"show": true
},
"yaxes": [
{
"format": "bytes",
"label": null,
"logBase": 1,
"max": null,
"min": null,
"show": true
},
{
"format": "short",
"label": null,
"logBase": 1,
"max": null,
"min": null,
"show": false
}
]
}
],
"title": "Containers memory usage"
},
{
"collapse": true,
"editable": true,
"height": "500px",
"panels": [
{
"aliasColors": {},
"bars": false,
"datasource": "${DS_PROMETHEUS}",
"decimals": 2,
"editable": true,
"error": false,
"fill": 0,
"grid": {
"threshold1": null,
"threshold1Color": "rgba(216, 200, 27, 0.27)",
"threshold2": null,
"threshold2Color": "rgba(234, 112, 112, 0.22)"
},
"id": 28,
"isNew": true,
"legend": {
"alignAsTable": true,
"avg": true,
"current": true,
"max": false,
"min": false,
"rightSide": false,
"show": true,
"sideWidth": 200,
"sort": "current",
"sortDesc": true,
"total": false,
"values": true
},
"lines": true,
"linewidth": 2,
"links": [],
"nullPointMode": "connected",
"percentage": false,
"pointradius": 5,
"points": false,
"renderer": "flot",
"seriesOverrides": [],
"span": 12,
"stack": false,
"steppedLine": false,
"targets": [
{
"expr": "sum (container_memory_working_set_bytes{id!=\"/\",kubernetes_io_hostname=~\"^$Node$\"}) by (id)",
"interval": "10s",
"intervalFactor": 1,
"legendFormat": "{{ id }}",
"metric": "container_memory_usage:sort_desc",
"refId": "A",
"step": 10
}
],
"timeFrom": null,
"timeShift": null,
"title": "All processes memory usage",
"tooltip": {
"msResolution": false,
"shared": true,
"sort": 2,
"value_type": "cumulative"
},
"type": "graph",
"xaxis": {
"show": true
},
"yaxes": [
{
"format": "bytes",
"label": null,
"logBase": 1,
"max": null,
"min": null,
"show": true
},
{
"format": "short",
"label": null,
"logBase": 1,
"max": null,
"min": null,
"show": false
}
]
}
],
"title": "All processes memory usage"
},
{
"collapse": false,
"editable": true,
"height": "250px",
"panels": [
{
"aliasColors": {},
"bars": false,
"datasource": "${DS_PROMETHEUS}",
"decimals": 2,
"editable": true,
"error": false,
"fill": 1,
"grid": {
"threshold1": null,
"threshold1Color": "rgba(216, 200, 27, 0.27)",
"threshold2": null,
"threshold2Color": "rgba(234, 112, 112, 0.22)"
},
"id": 16,
"isNew": true,
"legend": {
"alignAsTable": true,
"avg": true,
"current": true,
"max": false,
"min": false,
"rightSide": true,
"show": true,
"sideWidth": 200,
"sort": "current",
"sortDesc": true,
"total": false,
"values": true
},
"lines": true,
"linewidth": 2,
"links": [],
"nullPointMode": "connected",
"percentage": false,
"pointradius": 5,
"points": false,
"renderer": "flot",
"seriesOverrides": [],
"span": 12,
"stack": false,
"steppedLine": false,
"targets": [
{
"expr": "sum (rate (container_network_receive_bytes_total{image!=\"\",name=~\"^k8s_.*\",kubernetes_io_hostname=~\"^$Node$\"}[2m])) by (io_kubernetes_pod_name)",
"interval": "10s",
"intervalFactor": 1,
"legendFormat": "-> {{ io_kubernetes_pod_name }}",
"metric": "network",
"refId": "A",
"step": 10
},
{
"expr": "- sum (rate (container_network_transmit_bytes_total{image!=\"\",name=~\"^k8s_.*\",kubernetes_io_hostname=~\"^$Node$\"}[2m])) by (io_kubernetes_pod_name)",
"interval": "10s",
"intervalFactor": 1,
"legendFormat": "<- {{ io_kubernetes_pod_name }}",
"metric": "network",
"refId": "B",
"step": 10
}
],
"timeFrom": null,
"timeShift": null,
"title": "Pods network I/O",
"tooltip": {
"msResolution": false,
"shared": true,
"sort": 2,
"value_type": "cumulative"
},
"type": "graph",
"xaxis": {
"show": true
},
"yaxes": [
{
"format": "Bps",
"label": null,
"logBase": 1,
"max": null,
"min": null,
"show": true
},
{
"format": "short",
"label": null,
"logBase": 1,
"max": null,
"min": null,
"show": false
}
]
}
],
"title": "Pods network I/O"
},
{
"collapse": true,
"editable": true,
"height": "250px",
"panels": [
{
"aliasColors": {},
"bars": false,
"datasource": "${DS_PROMETHEUS}",
"decimals": 2,
"editable": true,
"error": false,
"fill": 1,
"grid": {
"threshold1": null,
"threshold1Color": "rgba(216, 200, 27, 0.27)",
"threshold2": null,
"threshold2Color": "rgba(234, 112, 112, 0.22)"
},
"id": 30,
"isNew": true,
"legend": {
"alignAsTable": true,
"avg": true,
"current": true,
"max": false,
"min": false,
"rightSide": true,
"show": true,
"sideWidth": 200,
"sort": "current",
"sortDesc": true,
"total": false,
"values": true
},
"lines": true,
"linewidth": 2,
"links": [],
"nullPointMode": "connected",
"percentage": false,
"pointradius": 5,
"points": false,
"renderer": "flot",
"seriesOverrides": [],
"span": 12,
"stack": false,
"steppedLine": false,
"targets": [
{
"expr": "sum (rate (container_network_receive_bytes_total{image!=\"\",name=~\"^k8s_.*\",kubernetes_io_hostname=~\"^$Node$\"}[1m])) by (io_kubernetes_container_name, io_kubernetes_pod_name)",
"hide": false,
"interval": "10s",
"intervalFactor": 1,
"legendFormat": "-> pod: {{ io_kubernetes_pod_name }} | {{ io_kubernetes_container_name }}",
"metric": "network",
"refId": "B",
"step": 10
},
{
"expr": "- sum (rate (container_network_transmit_bytes_total{image!=\"\",name=~\"^k8s_.*\",kubernetes_io_hostname=~\"^$Node$\"}[1m])) by (io_kubernetes_container_name, io_kubernetes_pod_name)",
"hide": false,
"interval": "10s",
"intervalFactor": 1,
"legendFormat": "<- pod: {{ io_kubernetes_pod_name }} | {{ io_kubernetes_container_name }}",
"metric": "network",
"refId": "D",
"step": 10
},
{
"expr": "sum (rate (container_network_receive_bytes_total{image!=\"\",name!~\"^k8s_.*\",kubernetes_io_hostname=~\"^$Node$\"}[1m])) by (kubernetes_io_hostname, name, image)",
"hide": false,
"interval": "10s",
"intervalFactor": 1,
"legendFormat": "-> docker: {{ kubernetes_io_hostname }} | {{ image }} ({{ name }})",
"metric": "network",
"refId": "A",
"step": 10
},
{
"expr": "- sum (rate (container_network_transmit_bytes_total{image!=\"\",name!~\"^k8s_.*\",kubernetes_io_hostname=~\"^$Node$\"}[1m])) by (kubernetes_io_hostname, name, image)",
"hide": false,
"interval": "10s",
"intervalFactor": 1,
"legendFormat": "<- docker: {{ kubernetes_io_hostname }} | {{ image }} ({{ name }})",
"metric": "network",
"refId": "C",
"step": 10
},
{
"expr": "sum (rate (container_network_transmit_bytes_total{rkt_container_name!=\"\",kubernetes_io_hostname=~\"^$Node$\"}[1m])) by (kubernetes_io_hostname, rkt_container_name)",
"hide": false,
"interval": "10s",
"intervalFactor": 1,
"legendFormat": "-> rkt: {{ kubernetes_io_hostname }} | {{ rkt_container_name }}",
"metric": "network",
"refId": "E",
"step": 10
},
{
"expr": "- sum (rate (container_network_transmit_bytes_total{rkt_container_name!=\"\",kubernetes_io_hostname=~\"^$Node$\"}[1m])) by (kubernetes_io_hostname, rkt_container_name)",
"hide": false,
"interval": "10s",
"intervalFactor": 1,
"legendFormat": "<- rkt: {{ kubernetes_io_hostname }} | {{ rkt_container_name }}",
"metric": "network",
"refId": "F",
"step": 10
}
],
"timeFrom": null,
"timeShift": null,
"title": "Containers network I/O",
"tooltip": {
"msResolution": false,
"shared": true,
"sort": 2,
"value_type": "cumulative"
},
"type": "graph",
"xaxis": {
"show": true
},
"yaxes": [
{
"format": "Bps",
"label": null,
"logBase": 1,
"max": null,
"min": null,
"show": true
},
{
"format": "short",
"label": null,
"logBase": 1,
"max": null,
"min": null,
"show": false
}
]
}
],
"title": "Containers network I/O"
},
{
"collapse": true,
"editable": true,
"height": "500px",
"panels": [
{
"aliasColors": {},
"bars": false,
"datasource": "${DS_PROMETHEUS}",
"decimals": 2,
"editable": true,
"error": false,
"fill": 1,
"grid": {
"threshold1": null,
"threshold1Color": "rgba(216, 200, 27, 0.27)",
"threshold2": null,
"threshold2Color": "rgba(234, 112, 112, 0.22)"
},
"id": 29,
"isNew": true,
"legend": {
"alignAsTable": true,
"avg": true,
"current": true,
"max": false,
"min": false,
"rightSide": false,
"show": true,
"sideWidth": 200,
"sort": "current",
"sortDesc": true,
"total": false,
"values": true
},
"lines": true,
"linewidth": 2,
"links": [],
"nullPointMode": "connected",
"percentage": false,
"pointradius": 5,
"points": false,
"renderer": "flot",
"seriesOverrides": [],
"span": 12,
"stack": false,
"steppedLine": false,
"targets": [
{
"expr": "sum (rate (container_network_receive_bytes_total{id!=\"/\",kubernetes_io_hostname=~\"^$Node$\"}[1m])) by (id)",
"interval": "10s",
"intervalFactor": 1,
"legendFormat": "-> {{ id }}",
"metric": "network",
"refId": "A",
"step": 10
},
{
"expr": "- sum (rate (container_network_transmit_bytes_total{id!=\"/\",kubernetes_io_hostname=~\"^$Node$\"}[1m])) by (id)",
"interval": "10s",
"intervalFactor": 1,
"legendFormat": "<- {{ id }}",
"metric": "network",
"refId": "B",
"step": 10
}
],
"timeFrom": null,
"timeShift": null,
"title": "All processes network I/O",
"tooltip": {
"msResolution": false,
"shared": true,
"sort": 2,
"value_type": "cumulative"
},
"type": "graph",
"xaxis": {
"show": true
},
"yaxes": [
{
"format": "Bps",
"label": null,
"logBase": 1,
"max": null,
"min": null,
"show": true
},
{
"format": "short",
"label": null,
"logBase": 1,
"max": null,
"min": null,
"show": false
}
]
}
],
"title": "All processes network I/O"
}
],
"time": {
"from": "now-1h",
"to": "now"
},
"timepicker": {
"refresh_intervals": [
"5s",
"10s",
"30s",
"1m",
"5m",
"15m",
"30m",
"1h",
"2h",
"1d"
],
"time_options": [
"5m",
"15m",
"1h",
"6h",
"12h",
"24h",
"2d",
"7d",
"30d"
]
},
"templating": {
"list": [
{
"allValue": ".*",
"current": {},
"datasource": "${DS_PROMETHEUS}",
"hide": 0,
"includeAll": true,
"multi": false,
"name": "Node",
"options": [],
"query": "label_values(kubernetes_io_hostname)",
"refresh": 1,
"type": "query"
}
]
},
"annotations": {
"list": []
},
"refresh": "1m",
"schemaVersion": 12,
"version": 21,
"links": [],
"gnetId": 315
}