Android MPAndroidChart:动态添加统计数据线【8】
本文在附录相关文章6的基础上,动态的依次增加若干条统计折线(相当于批量增加数据点)。
布局文件:
<LinearLayout xmlns:android="http://schemas.android.com/apk/res/android"
    xmlns:tools="http://schemas.android.com/tools"
    android:layout_width="match_parent"
    android:layout_height="match_parent"
    android:orientation="vertical"
    tools:context="zhangphil.chart.MainActivity" >

    <Button
        android:id="@+id/button"
        android:layout_width="wrap_content"
        android:layout_height="wrap_content"
        android:layout_gravity="center_horizontal"
        android:text="动态添加数据" />

    <com.github.mikephil.charting.charts.LineChart
        android:id="@+id/chart"
        android:layout_width="match_parent"
        android:layout_height="match_parent" />

</LinearLayout>
Java代码:
package zhangphil.chart;

import java.text.DecimalFormat;
import java.util.ArrayList;

import com.github.mikephil.charting.charts.LineChart;
import com.github.mikephil.charting.components.Legend;
import com.github.mikephil.charting.components.XAxis;
import com.github.mikephil.charting.components.XAxis.XAxisPosition;
import com.github.mikephil.charting.components.YAxis.AxisDependency;
import com.github.mikephil.charting.components.YAxis;
import com.github.mikephil.charting.components.Legend.LegendForm;
import com.github.mikephil.charting.components.Legend.LegendPosition;
import com.github.mikephil.charting.data.Entry;
import com.github.mikephil.charting.data.LineData;
import com.github.mikephil.charting.data.LineDataSet;
import com.github.mikephil.charting.formatter.ValueFormatter;
import com.github.mikephil.charting.utils.ColorTemplate;
import com.github.mikephil.charting.utils.ViewPortHandler;

import android.app.Activity;
import android.graphics.Color;
import android.os.Bundle;
import android.view.View;
import android.widget.Button;

public class MainActivity extends Activity {

	private int[] xIndex = new int[10];

	@Override
	protected void onCreate(Bundle savedInstanceState) {
		super.onCreate(savedInstanceState);
		setContentView(R.layout.activity_main);

		for (int i = 0; i < xIndex.length; i++) {
			xIndex[i] = i;
		}

		final LineChart mChart = (LineChart) findViewById(R.id.chart);
		initialChart(mChart);

		// 每点击一次按钮,增加一条统计折线
		Button addButton = (Button) findViewById(R.id.button);
		addButton.setOnClickListener(new View.OnClickListener() {

			@Override
			public void onClick(View v) {
				addLineDataSet(mChart);
			}
		});
	}

	// 初始化图表
	private void initialChart(LineChart mChart) {
		mChart.setDescription("Zhang Phil @ http://blog.csdn.net/zhangphil");
		mChart.setNoDataTextDescription("暂时尚无数据");

		mChart.setTouchEnabled(true);

		// 可拖曳
		mChart.setDragEnabled(true);

		// 可缩放
		mChart.setScaleEnabled(true);

		mChart.setDrawGridBackground(false);

		mChart.setPinchZoom(true);

		// 设置图表的背景颜色
		mChart.setBackgroundColor(Color.WHITE);

		// 图表的注解(只有当数据集存在时候才生效)
		Legend l = mChart.getLegend();

		// 可以修改图表注解部分的位置
		l.setPosition(LegendPosition.ABOVE_CHART_RIGHT);

		// 线性,也可是圆
		l.setForm(LegendForm.SQUARE);

		// 颜色
		l.setTextColor(Color.CYAN);

		// x坐标轴
		XAxis xl = mChart.getXAxis();
		xl.setTextColor(Color.BLUE);
		xl.setDrawGridLines(false);
		xl.setAvoidFirstLastClipping(true);

		// 几个x坐标轴之间才绘制?
		xl.setSpaceBetweenLabels(5);

		// 如果false,那么x坐标轴将不可见
		xl.setEnabled(true);

		// 将X坐标轴放置在底部,默认是在顶部。
		xl.setPosition(XAxisPosition.BOTTOM);

		// 图表左边的y坐标轴线
		YAxis leftAxis = mChart.getAxisLeft();
		leftAxis.setTextColor(Color.RED);

		// 最大值
		leftAxis.setAxisMaxValue(120f);

		// 最小值
		leftAxis.setAxisMinValue(-10f);

		// 不一定要从0开始
		leftAxis.setStartAtZero(false);

		leftAxis.setDrawGridLines(true);

		YAxis rightAxis = mChart.getAxisRight();
		// 不显示图表的右边y坐标轴线
		rightAxis.setEnabled(false);
	}

	// 为LineChart增加LineDataSet
	private void addLineDataSet(LineChart mChart) {
		LineData data = mChart.getLineData();
		if (data == null) {
			data = new LineData();
			for (int i = 0; i < xIndex.length; i++) {
				data.addXValue("x:" + i);
			}

			mChart.setData(data);
		}

		addLineDataSet(data);

		mChart.notifyDataSetChanged();
		mChart.invalidate();

		// 当前统计图表中最多在x轴坐标线上显示的总量
		// mChart.setVisibleXRangeMaximum(5);
		// mChart.moveViewToX(data.getXValCount() - 5);

		//mChart.animateX(3000);
	}

	// 初始化数据集,添加一条统计折线
	private void addLineDataSet(LineData data) {
		int count = data.getDataSetCount();

		LineDataSet mLineDataSet = new LineDataSet(getEntry(count), "数据集" + count);

		mLineDataSet.setAxisDependency(AxisDependency.LEFT);

		int color = ColorTemplate.JOYFUL_COLORS[count % ColorTemplate.JOYFUL_COLORS.length];

		// 折线的颜色
		mLineDataSet.setColor(color);
		mLineDataSet.setCircleColor(Color.DKGRAY);
		mLineDataSet.setLineWidth(5f);
		mLineDataSet.setCircleSize(10f);

		// 改变折线样式,用曲线。
		mLineDataSet.setDrawCubic(true);
		// 默认是直线
		// 曲线的平滑度,值越大越平滑。
		mLineDataSet.setCubicIntensity(0.2f);

		// 填充曲线下方的区域,红色,半透明。
		mLineDataSet.setDrawFilled(true);
		mLineDataSet.setFillAlpha(128);
		mLineDataSet.setFillColor(color);

		mLineDataSet.setCircleColorHole(Color.YELLOW);
		mLineDataSet.setHighLightColor(Color.GREEN);
		mLineDataSet.setValueTextColor(color);
		mLineDataSet.setValueTextSize(10f);
		mLineDataSet.setDrawValues(true);

		mLineDataSet.setValueFormatter(new ValueFormatter() {
			@Override
			public String getFormattedValue(float value, Entry entry, int dataSetIndex,
					ViewPortHandler viewPortHandler) {
				DecimalFormat decimalFormat = new DecimalFormat(".0");
				String s = "y:" + decimalFormat.format(value);
				return s;
			}
		});

		data.addDataSet(mLineDataSet);
	}

	private ArrayList<Entry> getEntry(int count) {
		ArrayList<Entry> y = new ArrayList<Entry>();
		for (int index : xIndex) {
			float val = (float) (Math.random() * 10 + (100-10 * count));
			Entry entry = new Entry(val, index);
			y.add(entry);
		}

		return y;
	}
}
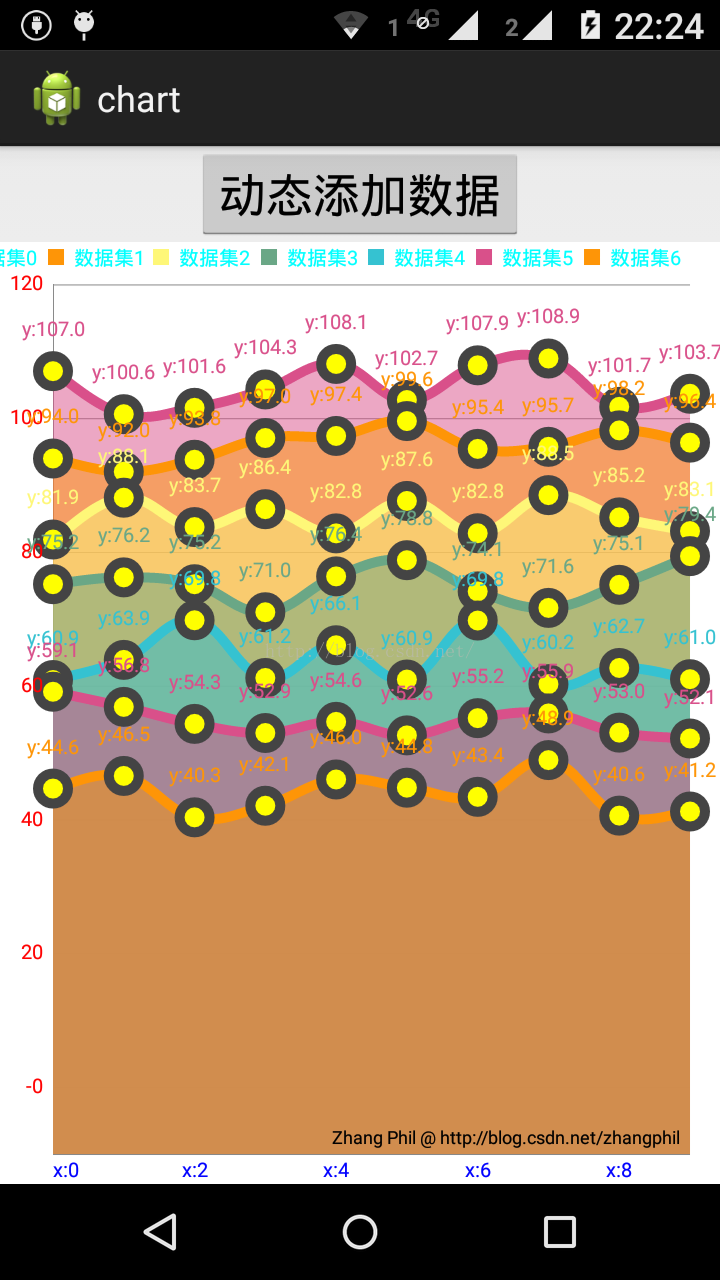
代码运行结果,动图展现动态效果:
截取的一张静态图:
相关文章:
【1】《Android统计图表MPAndroidChart》链接地址:http://blog.csdn.net/zhangphil/article/details/47656521
【2】《基于Android MPAndroidChart实现腾讯QQ群数据统计报表核心功能》链接地址:http://blog.csdn.net/zhangphil/article/details/47685515
【3】《Android实现天气预报温度/气温折线趋势图》链接地址:http://blog.csdn.net/zhangphil/article/details/47702245
【4】《Android统计图表之柱状图(条形图)》链接地址:http://blog.csdn.net/zhangphil/article/details/47727913
【5】《Android MPAndroidChart之PieChart和数据结构以及模型【5】》链接地址:http://blog.csdn.net/zhangphil/article/details/50172817
【6】《Android统计图表MPAndroidChart:动态添加数据更新【6】》链接地址:http://blog.csdn.net/zhangphil/article/details/50185115
【7】《Android统计图表MPAndroidChart:为多条统计折线动态更新数据,以高温低温曲线为例【7】》链接地址:http://blog.csdn.net/zhangphil/article/details/50186775
【8】MPAndroidChart在github上的项目主页:https://github.com/PhilJay/MPAndroidChart