本文将阐述 Ceilometer 中的数据收集机制。Ceilometer 使用三种机制来收集数据:
- Notifications:Ceilometer 接收 OpenStack 其它服务发出的 notification message
- Polling:直接从 Hypervisor 或者 使用 SNMP 从host machine,或者使用 OpenStack 其它服务的 API 来获取数据。
- RESTful API:别的 application 使用 Ceilometer 的 REST API 创建 samples。
1. Notifications
1.1 被 Ceilometer 处理的 notifications
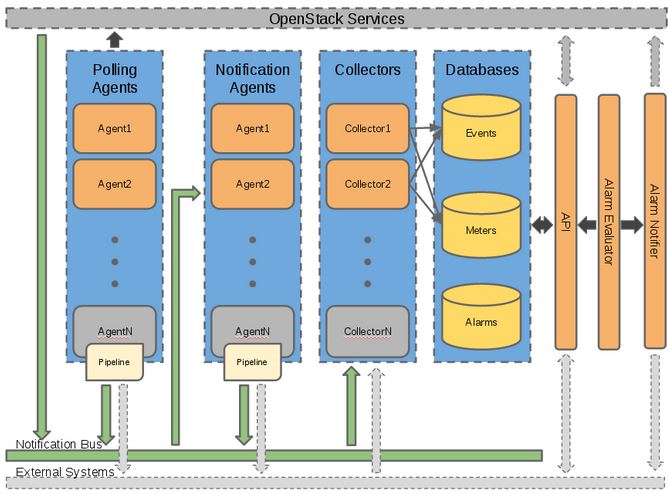
所有的 OpenStack 服务都会在执行了某种操作或者状态变化时发出 notification。一些 nofication message 会包含 metering 需要的数据,这部分消息会被ceilometer 处理并转化为samples。下表列出了目前 Ceilometer 所处理的各服务的notification:
(参考文档: http://docs.openstack.org/admin-guide-cloud/content/section_telemetry-notifications.html)
| OpenStack service | Event types | Note |
| OpenStack Compute | scheduler.run_instance.scheduled,scheduler.select_destinations compute.instance.* |
For a more detailed list of Compute notifications please check the System Usage Data wiki page. |
| Bare metal module for OpenStack | hardware.ipmi.* | |
| OpenStack Image Service | image.update,image.upload,image.delete,image.send |
The required configuration for Image service can be found in the Configure the Image Service for Telemetry section section in theOpenStack Installation Guide. |
| OpenStack Networking | floatingip.create.end,floatingip.update.*,floatingip.exists network.create.end,network.update.*,network.exists port.create.end,port.update.*,port.exists router.create.end,router.update.*,router.exists subnet.create.end,subnet.update.*,subnet.exists l3.meter |
|
| Orchestration module | orchestration.stack.create.end,orchestration.stack.update.end orchestration.stack.delete.end,orchestration.stack.resume.end orchestration.stack.suspend.end |
|
| OpenStack Block Storage | volume.exists,volume.create.*,volume.delete.* volume.update.*,volume.resize.*,volume.attach.* volume.detach.* snapshot.exists,snapshot.create.* snapshot.delete.*,snapshot.update.* |
The required configuration for Block Storage service can be found in the Add the Block Storage service agent for Telemetry sectionsection in the OpenStack Installation Guide. |
1.2 Cinder Volume Notificaitons 发出过程
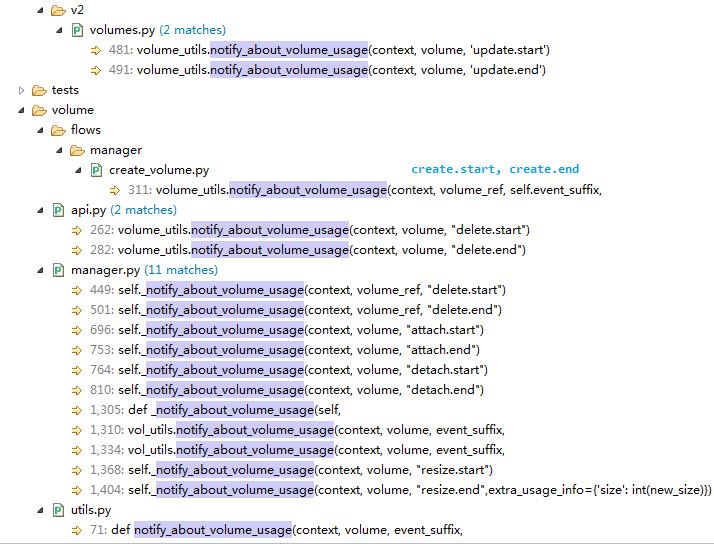
Cinder 中 /cinder/volume/util.py 的 notify_about_volume_usage 函数负责调用 oslo.message 的方法来发出 volume usage 相关的 notificaiton message:

def notify_about_volume_usage(context, volume, event_suffix,
                              extra_usage_info=None, host=None):
    if not host:
        host = CONF.host
    if not extra_usage_info:
        extra_usage_info = {}
    usage_info = _usage_from_volume(context, volume, **extra_usage_info)
    rpc.get_notifier("volume", host).info(context, 'volume.%s' % event_suffix, usage_info)
下图显示了该函数被调用的地方。可见:
- Controller 节点上的 cinder-api 会发出 Info 级别的 volume.update.* notificaiton
- Controller 节点上的 cinder-scheduler 会发出 Info 级别的volume.create.* notification
- Volume 节点上的 cinder-volume 会发出 Info 级别的别的 volume.*.* notificaiton
再看看 notification 发出的时机。以 volume.update.* 为例:
 @wsgi.serializers(xml=VolumeTemplate)
    def update(self, req, id, body):
        """Update a volume."""
       ...

        try:
            volume = self.volume_api.get(context, id, viewable_admin_meta=True)
            volume_utils.notify_about_volume_usage(context, volume, 'update.start') #开始更新前发出 volume.update.start notificaiton
            self.volume_api.update(context, volume, update_dict)
        except exception.NotFound:
            msg = _("Volume could not be found")
            raise exc.HTTPNotFound(explanation=msg)

        volume.update(update_dict)
        utils.add_visible_admin_metadata(volume)
        volume_utils.notify_about_volume_usage(context, volume, 'update.end') #更新结束后发出 volume.update.end notification
        return self._view_builder.detail(req, volume)
在来看看使用 notificaiton driver 是如何发出 notification 的:
// /oslo/messaging/notify/_impl_messaging.py,

// notificaiton driver 由 cinder.conf 配置项 notification_driver = cinder.openstack.common.notifier.rpc_notifier 指定,它实际对应的是 oslo.messaging.notify._impl_messaging:MessagingDriver (对应关系由 cinder/setup.cfg 定义)

def notify(self, ctxt, message, priority, retry):
        priority = priority.lower()
        for topic in self.topics:
            target = messaging.Target(topic='%s.%s' % (topic, priority)) #topic 是 notificaitons.info,因此会被发到同名的queue。使用默认的由 cinder.conf 中配置项 control_exchange 指定的exchange,其默认值为 openstack。而 topic 中的 "notifications" 由配置项 #notification_topics=notifications 指定。
            try:
                self.transport._send_notification(target, ctxt, message, version=self.version, retry=retry) #Send a notify message on a topic
            except Exception:
                ......
因此,为了 Cinder 能正确发出 notificaiton 被 Ceilometer 接收到,需要在 controller 节点和 cinder-volume 节点上的 cinder.conf 中做如下配置:
control_exchange = cinder #因为queue "notificaitons.info" 是 bind 到 "cinder" exchange 上的,所以 cinder 的 notificaiton message 需要被发到 “cinder” exchange。
notification_driver = cinder.openstack.common.notifier.rpc_notifier #在某些时候 /oslo/messaging/notify/_impl_messaging.py 不存在,需要手工从别的地方拷贝过来
Cinder 还有会同样的方式发出别的资源的notification:
 81: rpc.get_notifier("volume", host).info(context, 'volume.%s' % event_suffix,
113: rpc.get_notifier('snapshot', host).info(context, 'snapshot.%s' % event_suffix,
129: rpc.get_notifier('replication', host).info(context, 'replication.%s' % suffix,
145: rpc.get_notifier('replication', host).error(context, 'replication.%s' % suffix,
174: rpc.get_notifier("consistencygroup", host).info(context,'consistencygroup.%s' % event_suffix,
204: rpc.get_notifier("cgsnapshot", host).info(
但是目前 Ceilometer 只处理 volume 和 snapshot notificaiton message。
1.3 Ceilometer 处理 Volume notifications 的过程
Ceilometer 从 AMQP message queue "notifications.info" 中获取 notificaiton 消息。该 queue 的名字由 ceilometer.conf 中的配置项 notification_topics = notifications 指定。它会按照一定的方法将 notification 转化为 ceilometer event,然后再转化为 samples。
1.4 Cinder 到 Ceilometer 全过程
(1) cinder-* 发出 event-type 为 "volume.*.*" topic 为"<topic>.<priority>" 的消息 到 类型为 topic 名为 <service> 的exchange
(2)exchange <service> 和 queue "<topic>.<priority>" 使用 routing-key "<topic>.<priority>" 绑定
(3)notificaiton message 被 exchange 转发到 queue "<topic>.<priority>"
(4)ceilometer-agent-notification 从 queue "<topic>.<priority>" 中获取 message

这里对cinder 来说:
- <service> 是 "cinder"。需要注意 cinder 默认的 control exchange 是 "openstack",所以使用 ceilometer 时需要将其修改为 "cinder"。
- <topic> 是 "notificaitons",由 cinder.conf 中的配置项 notification_topics=notifications 指定。
- <priority> 是 "info",由 cinder 代码中写死的。
- notificaiton message 的数据内容可参考 https://wiki.openstack.org/wiki/SystemUsageData
2. Polling
Ceilometer 的 polling 机制使用三种类型的 agent:
- Compute agent
- Central agent
- IPMI agent
在 Kilo 版本中,这些 agent 都属于 ceilometer-polling,不同的是,每种agent使用不同的 polling plug-ins (pollsters)
2.1 Central agent
该 agent 负责使用个 OpenStack 服务的 REST API 来获取 openstack 资源的各种信息,以及通过 SNMP 来获取 hardware 资源的信息。这些资源包括:
-
OpenStack Networking
-
OpenStack Object Storage
-
OpenStack Block Storage
-
Hardware resources via SNMP
-
Energy consumption metrics via Kwapi framework
该 agent 收集到的 samples 会通过 AMQP 发给 Ceilometer Collector 或者外部系统。
2.2 Compute agent
Compute agent 安装在 compute node 上,负责收集在上面运行的虚机的使用数据。它是通过调用 hypervisor SDK 来收集数据的。到目前为止支持的hypervisor包括:
- Kernel-based Virtual Machine (KVM)
- Quick Emulator (QEMU)
- Linux Containers (LXC)
- User-mode Linux (UML)
- Hyper-V
- XEN
- VMWare vSphere
除了虚机外,该 agent 还能够收集 compute 节点 cpu 的数据。这功能需要配置 nova.conf 文件中的 compute_monitors 项为 ComputeDriverCPUMonitor。
2.3 IPMI agent
IPMI agent 负责在 compute 节点上收集 IPMI 传感器(sensor)的数据,以及Intel Node Manager 的数据。
3. 使用 Ceilometer REST API 创建 samples
$ ceilometer sample-create -r 37128ad6-daaa-4d22-9509-b7e1c6b08697 -m memory.usage --meter-type gauge --meter-unit MB --sample-volume 48
+-------------------+--------------------------------------------+
| Property          | Value                                      |
+-------------------+--------------------------------------------+
| message_id        | 6118820c-2137-11e4-a429-08002715c7fb       |
| name              | memory.usage                               |
| project_id        | e34eaa91d52a4402b4cb8bc9bbd308c1           |
| resource_id       | 37128ad6-daaa-4d22-9509-b7e1c6b08697       |
| resource_metadata | {}                                         |
| source            | e34eaa91d52a4402b4cb8bc9bbd308c1:openstack |
| timestamp         | 2014-08-11T09:10:46.358926                 |
| type              | gauge                                      |
| unit              | MB                                         |
| user_id           | 679b0499e7a34ccb9d90b64208401f8e           |
| volume            | 48.0                                       |
+-------------------+--------------------------------------------+
4. 收集 Neutron Bandwidth samples
Havana 版本中添加该功能。与 Ceilometer 其他采集方式不同的是,bandwidth 的采集是通过 neutron-meter-agent 收集,然后 push 到 oslo-messaging,ceilometer-agent-notification通过监听消息队列来收取bandwidth信息。
其实现是在 L3 router 层次来收集数据,因此需要操作员配置 IP 范围以及设置标签(label)。比如,我们加两个标签,一个表示内部网络流量,另一个表示外部网络流量。每个标签会计量一定IP范围内的流量。然后,每个标签的带宽的测量数据会被发到 MQ,然后被 Ceilometer 收集到。
参考链接:
https://wiki.openstack.org/wiki/Neutron/Metering/Bandwidth
https://openstackr.wordpress.com/2014/05/23/bandwidth-monitoring-with-neutron-and-ceilometer/
5. 收集物理设备samples
5.1 使用 kwapi kwapi 收集设备能耗数据
- Energy (cumulative type): 表示 kWh.
- Power (gauge type): 表示 watts.
Ceilometer central agent 的 pollers 直接调用 kwapi 的 API 来获取 samples。

参考文档:
http://kwapi.readthedocs.org/en/latest/architecture.html
http://blog.zhaw.ch/icclab/collecting-energy-consumption-data-using-kwapi-in-openstack/
http://perso.ens-lyon.fr/laurent.lefevre/greendayslux/GreenDays_Rossigneux.pdf
5.2 使用 snmp 协议收集硬件的CPU、MEM、IO等信息
在 IceHouse 中新增该功能。
参考文档:http://www.cnblogs.com/smallcoderhujin/p/4150368.html
6. 基于 OpenDayLight 收集 SDN samples
- Central agent 不直接调用 OpenDayLight 的 REST API,而是实现了一个 driver 来调用。
- Driver 调用 REST API 收集统计数据,返回 volume、resource id 和 metadata 给 pollster。
- Pollster 负责产生 samples。
实现代码在OpenStack 的 \ceilometer\network\statistics 目录中。